and Chasing
[Index][Archives]
Mesocyclone Develops on a Triple Point in Western Sydney: Monday 31st October 2005
Report compiled by Jimmy Deguara and Michael Bath
| Storm News and Chasing [Index][Archives] |
Mesocyclone Develops on a Triple Point in Western Sydney: Monday 31st October 2005 Report compiled by Jimmy Deguara and Michael Bath |
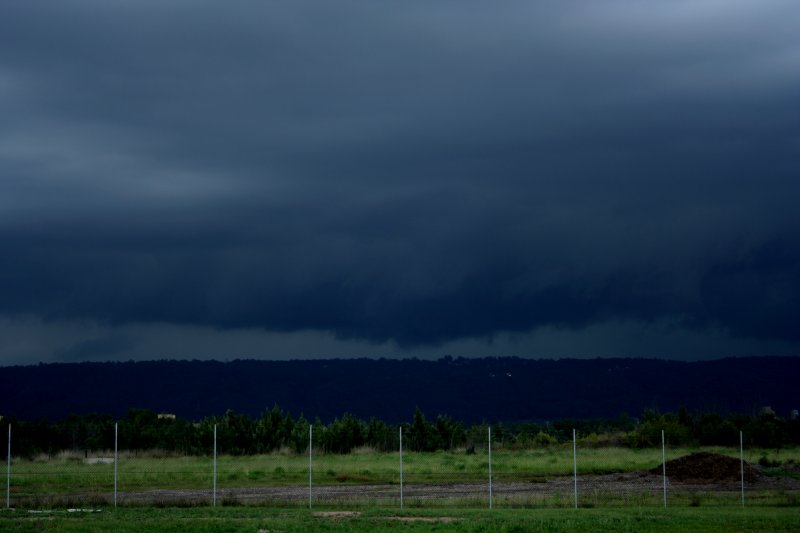
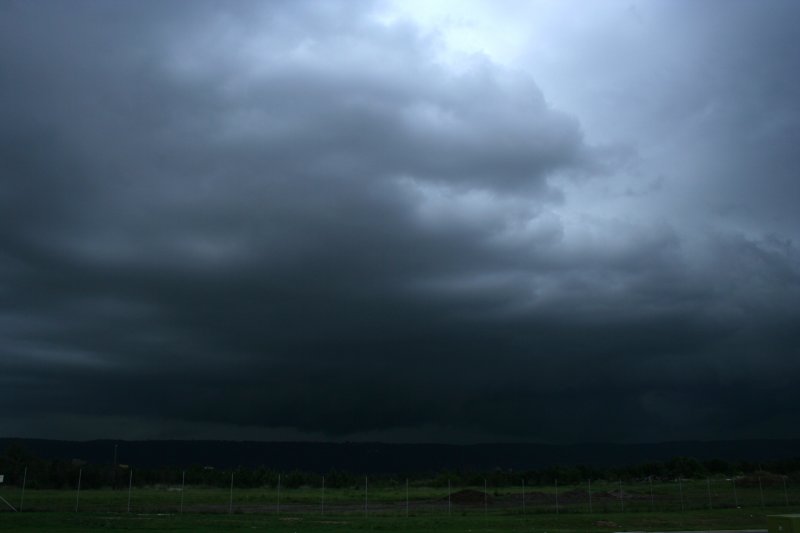
October showed some conditions that put western Sydney in a favourable situation for severe storms due to high CAPE, excellent deep layer shear (for Australian conditions) and reasonable moisture profile. But nothing would prepare me and Jeff Brislane for what we would witness from different vantage points!
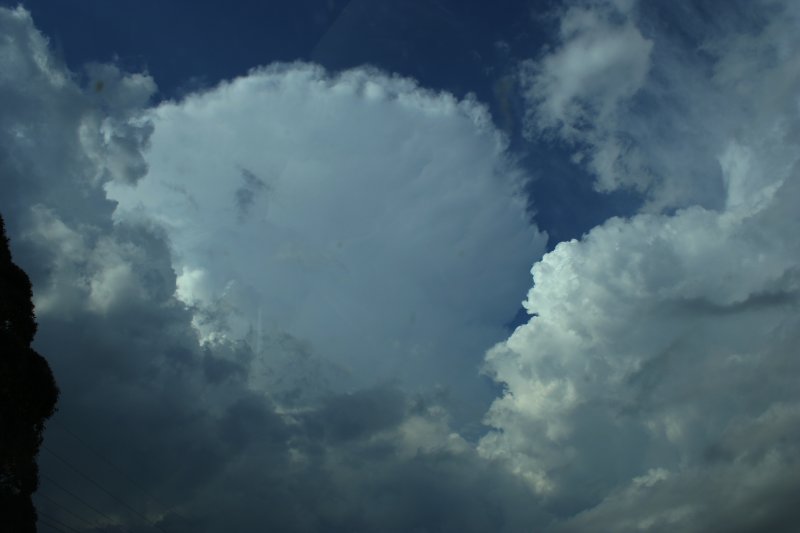
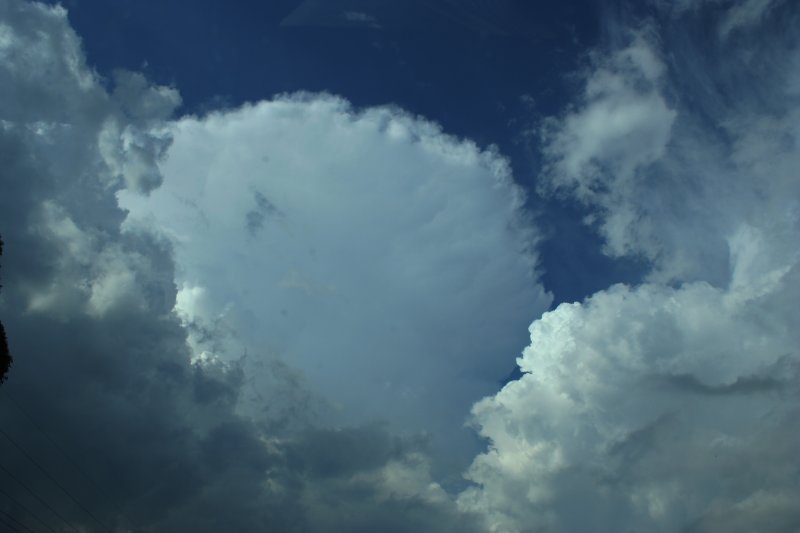
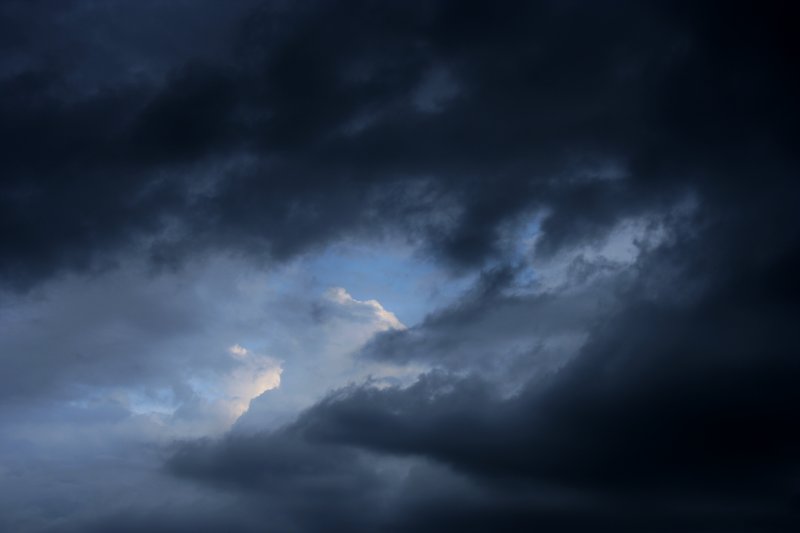
After watching video, it is interesting that there was pronounced and prolonged rotation - so I was not imagining things! In fact some tornadic funnels formed under the main centre of rotation! This mesocyclone developed on a triple point so it will be interesting to see the doppler images for this time! Given the high CAPE and moderate wind shear environment, and of course the low condensation levels, in hindsight it is not unexpected.
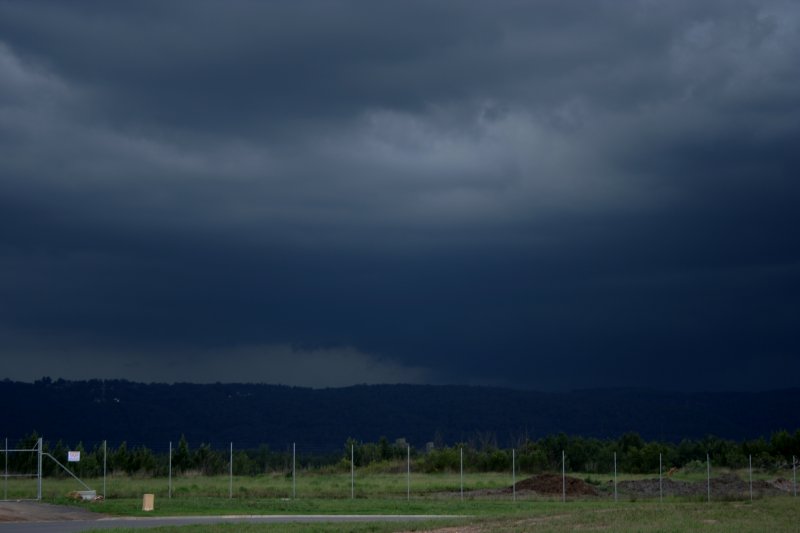
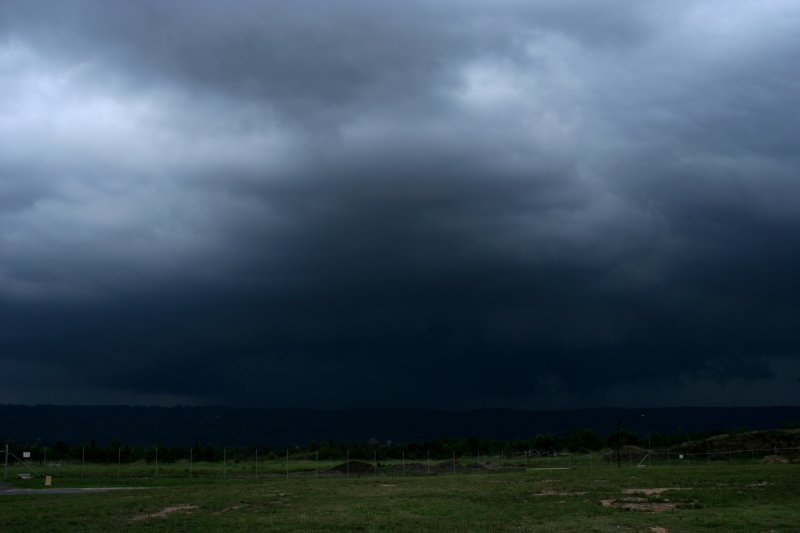
Obviously a triple point was evident within the environment of the storm - well the storm developed along a triple point. With high CAPE, the upmotion was incredible and sustained for at least 30 to 40 minutes and likely longer. The interesting behaviour began earlier but it seemed to become hidden by rain for a little while. Then a shelf cloud emerged so I prepared for an evacuation in order to remain ahead. But the storm with shelf cloud reorganised due to stronger deep inflow and the rotation once again developed. It was amazing to observe inflow from the east where I was and even northeast on the northern side and southeast on the southern side of the 'mesocyclone'! I am going to investigate this one further with the Bureau of Meteorology.
If you have any reports or photos you would like to provide about this storm, please send an email to Jimmy Deguara
From Weatherzone and Bureau of Meteorology
 11am to 10pm local
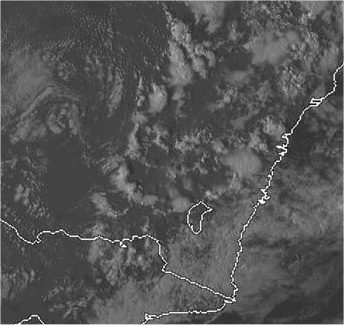 5pm local
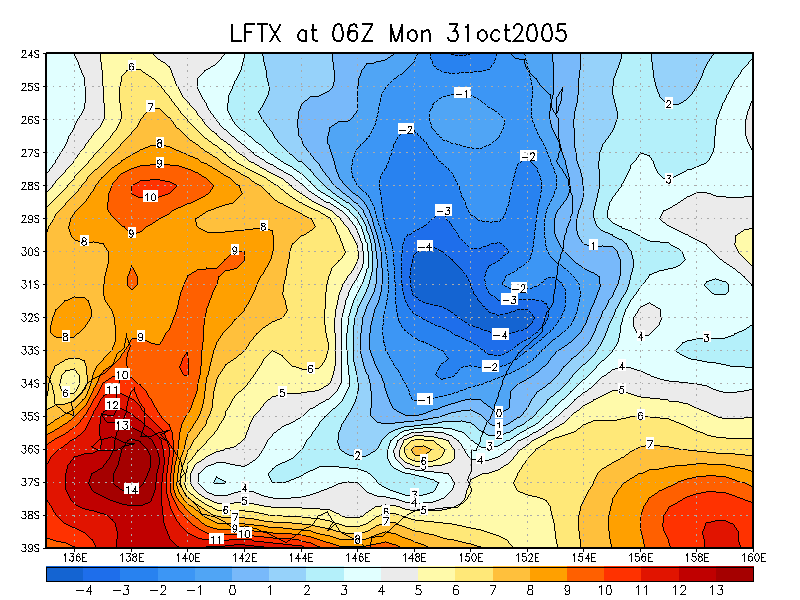
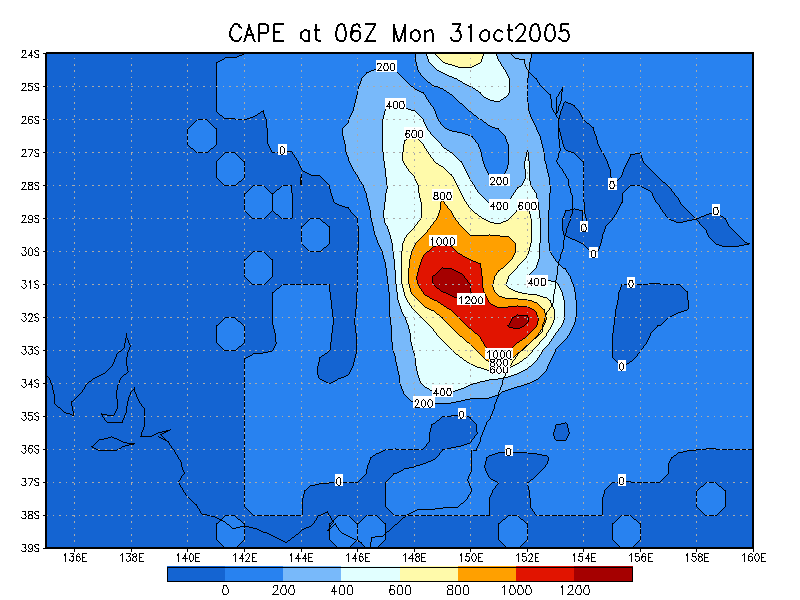
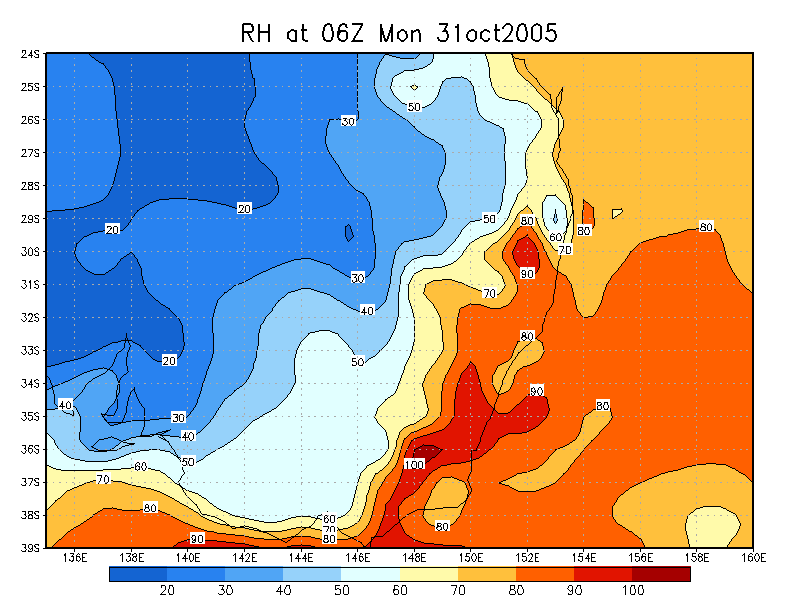
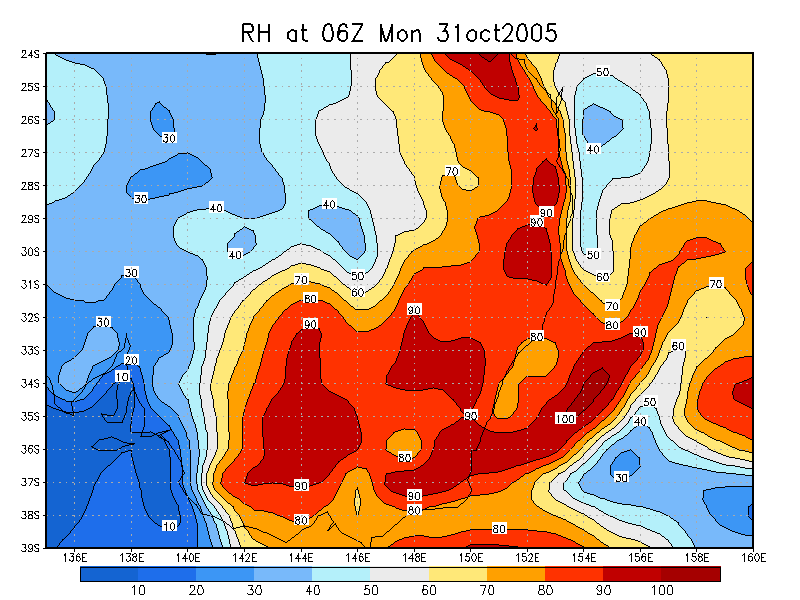
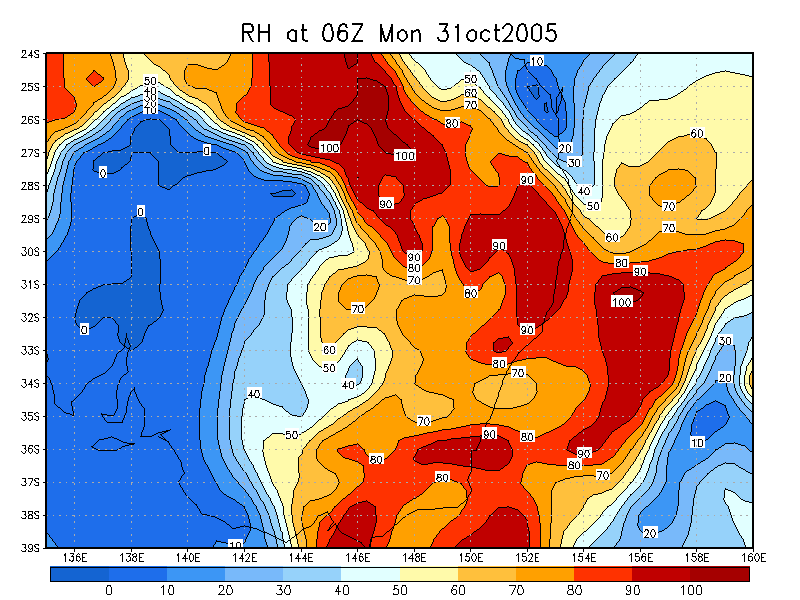
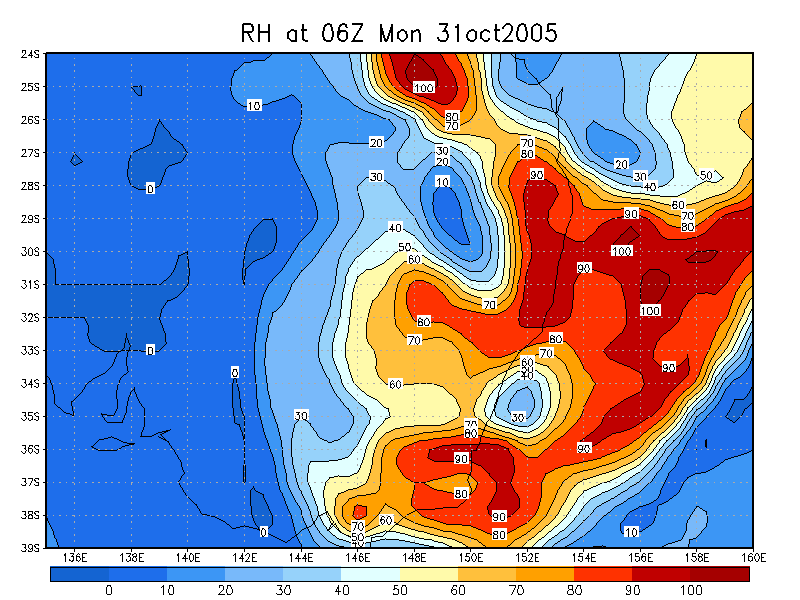
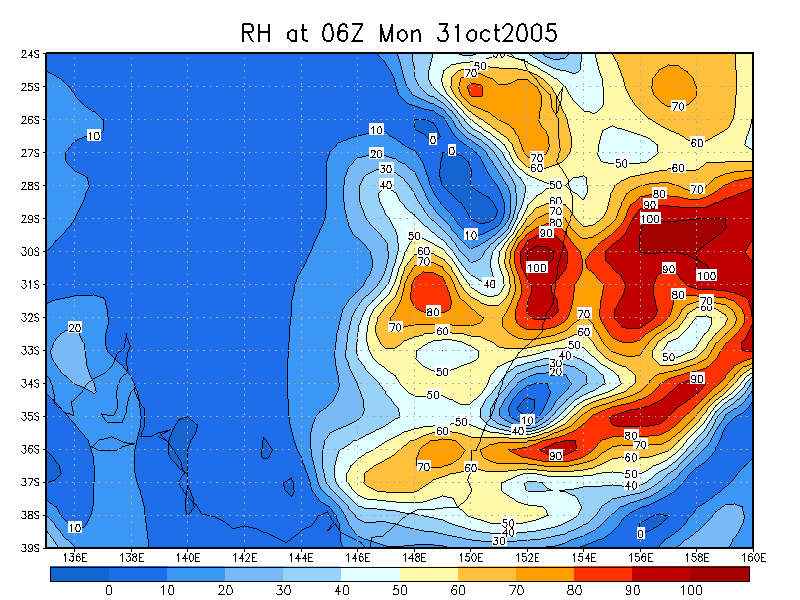
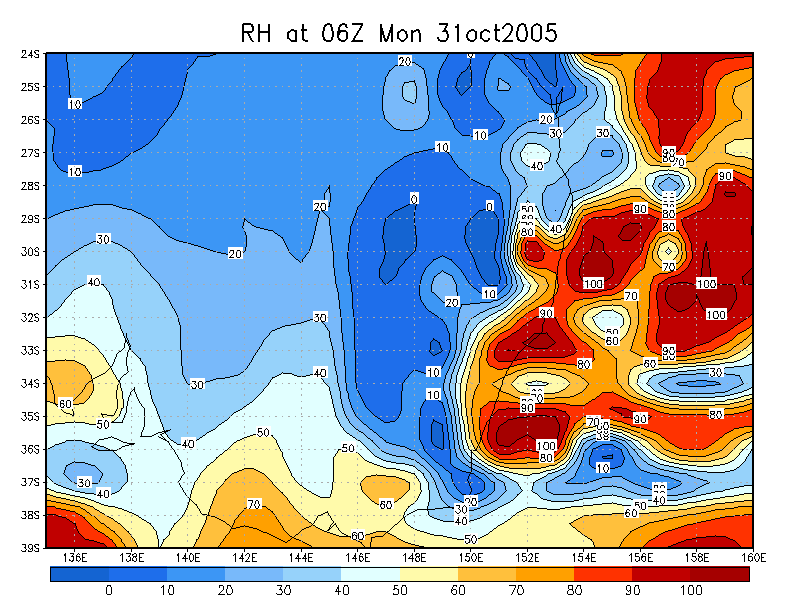
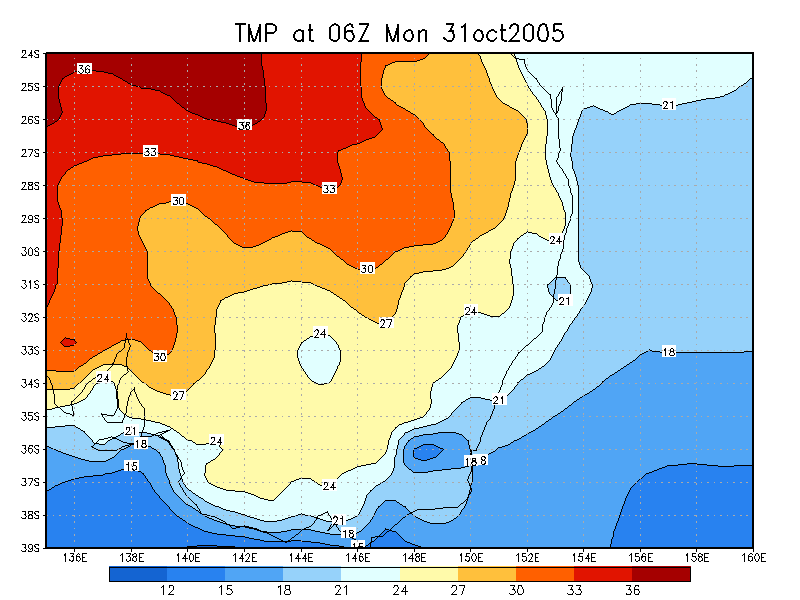
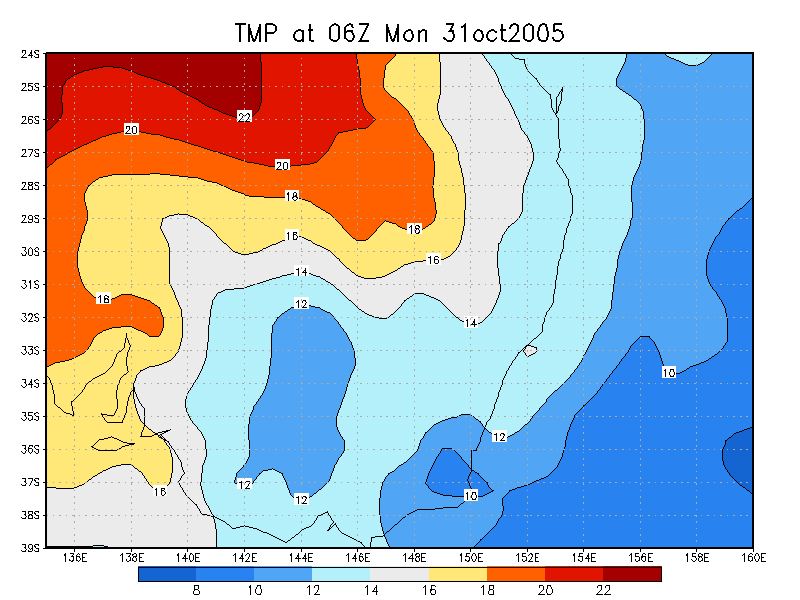
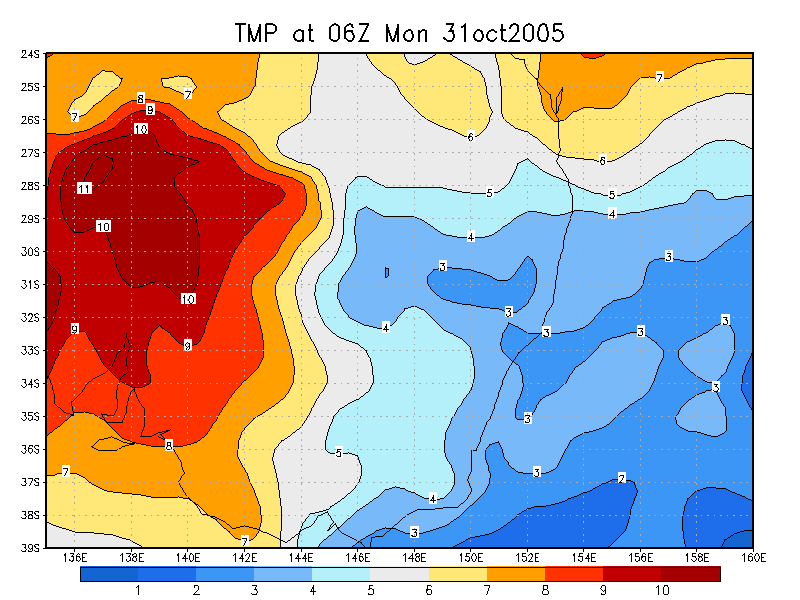
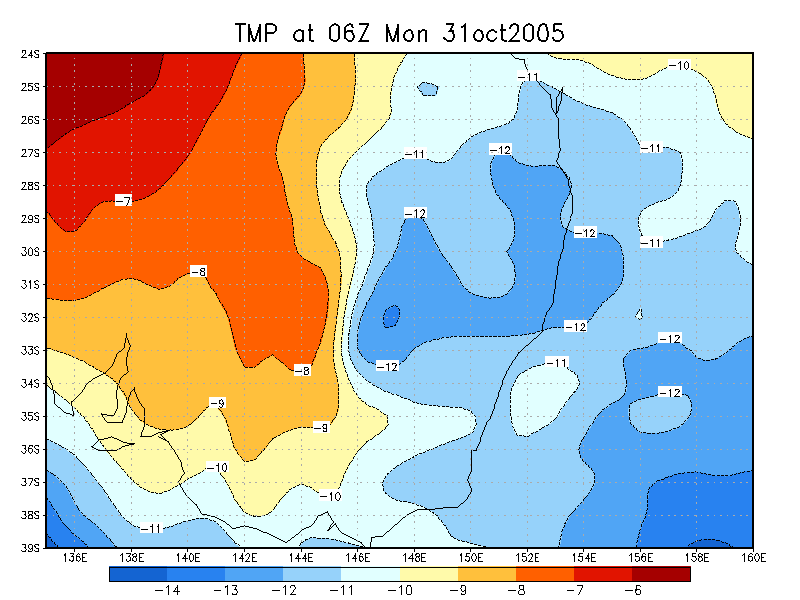
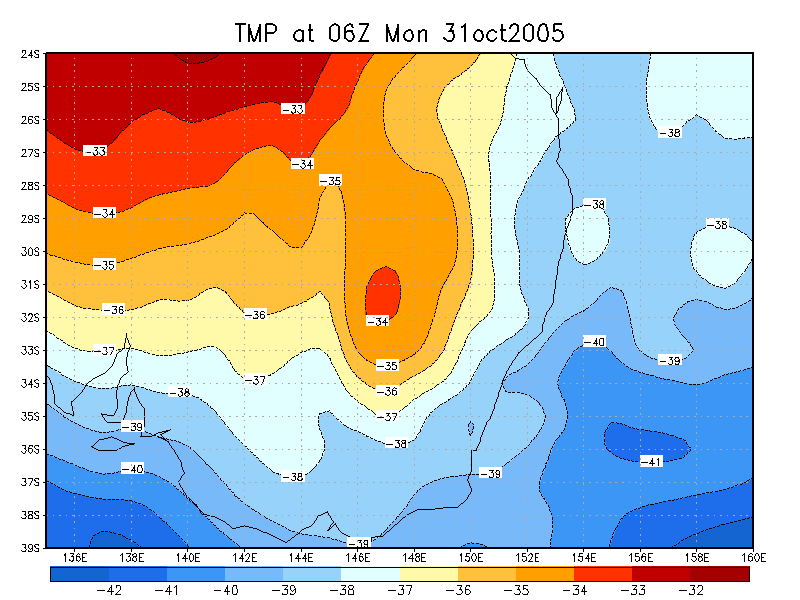
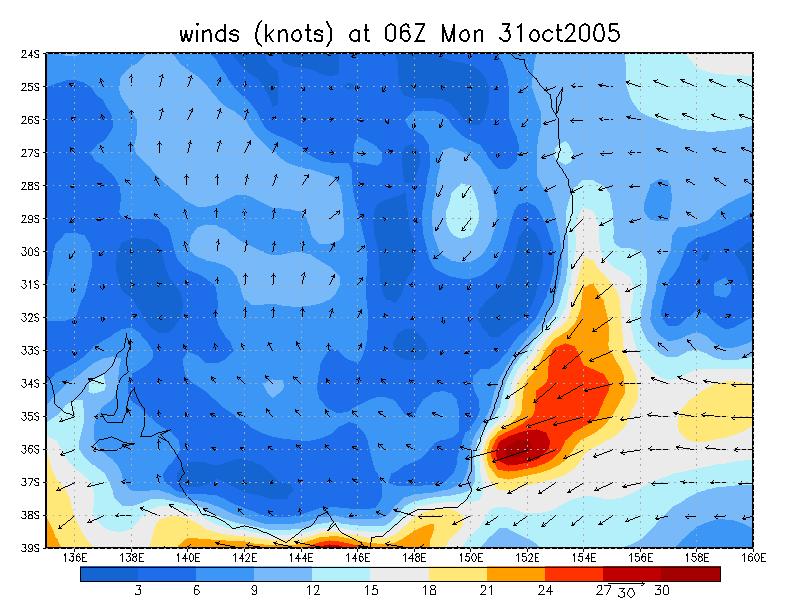
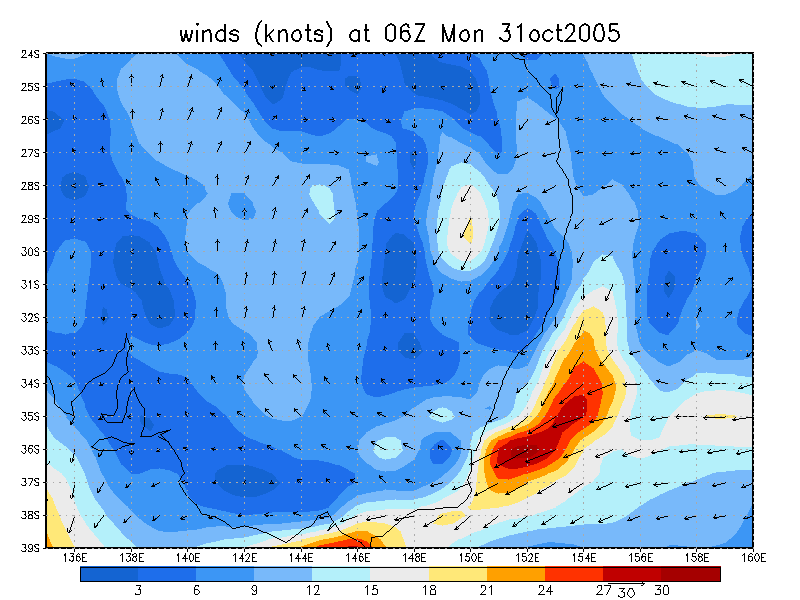
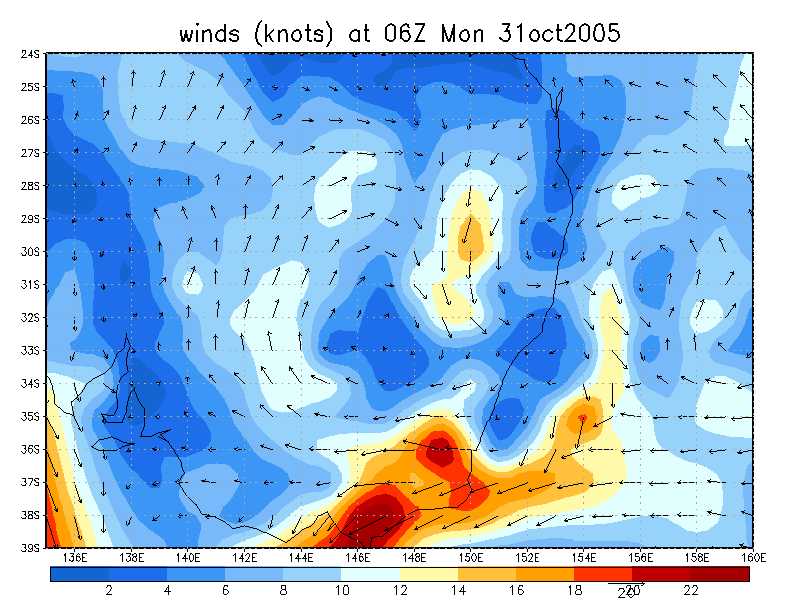
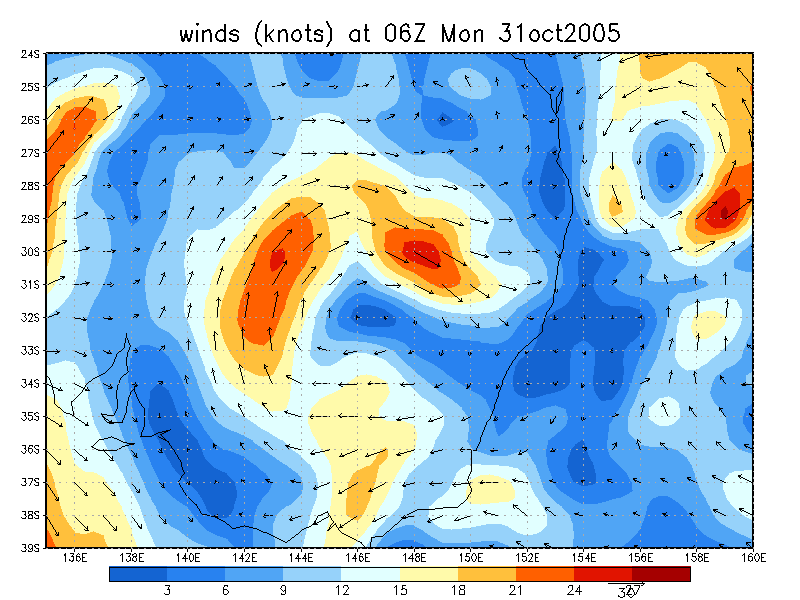
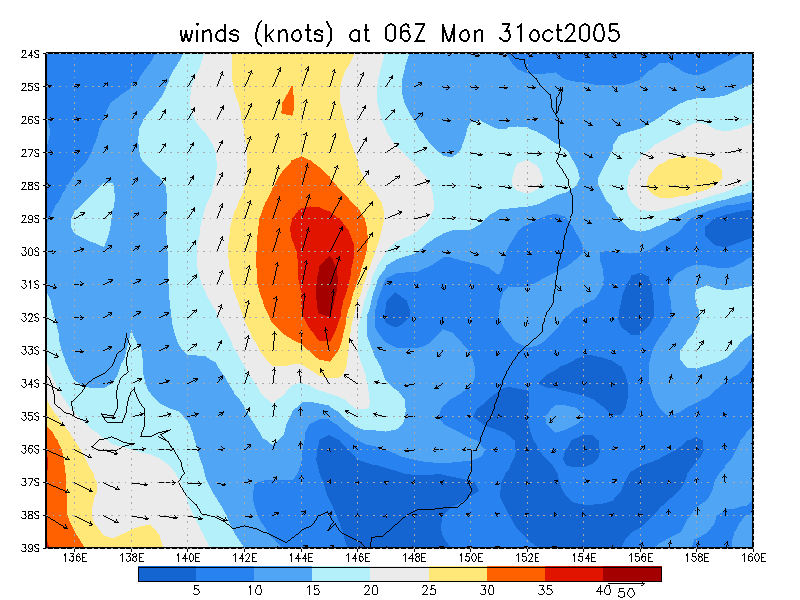
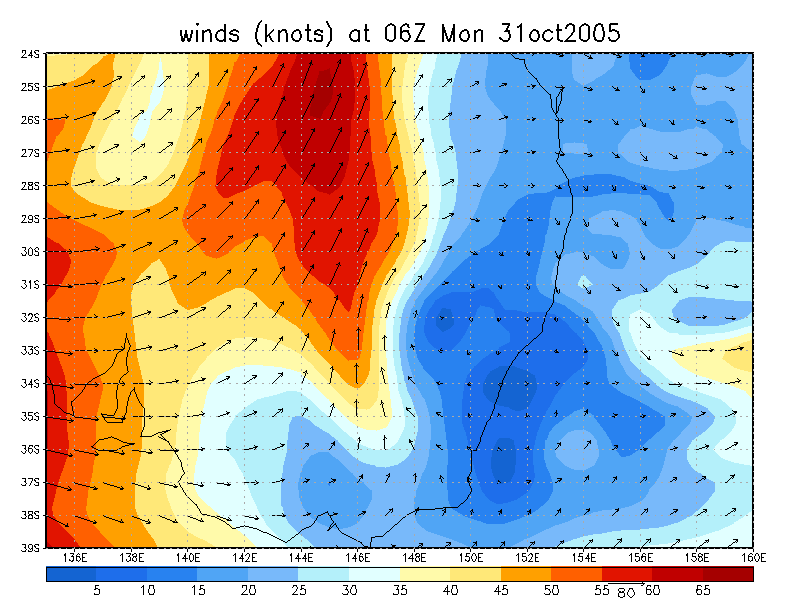
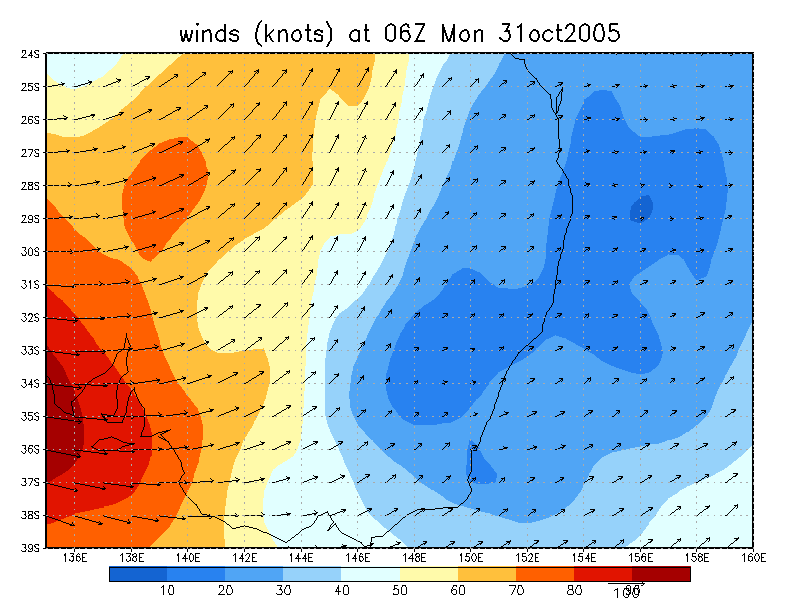
From NOAA 31/10/2005 06z analysis
|
Document: 200510-07.htm Updated: 18th December, 2005 |
[Australian Severe Weather index] [Copyright Notice] [Email Contacts] [Search This Site] |