and Chasing
[Index][Archives]
Spectacular Night Shelf Cloud at Ballina: Tuesday 15th November 2005
Report compiled by Michael Bath
| Storm News and Chasing [Index][Archives] |
Spectacular Night Shelf Cloud at Ballina: Tuesday 15th November 2005 Report compiled by Michael Bath |
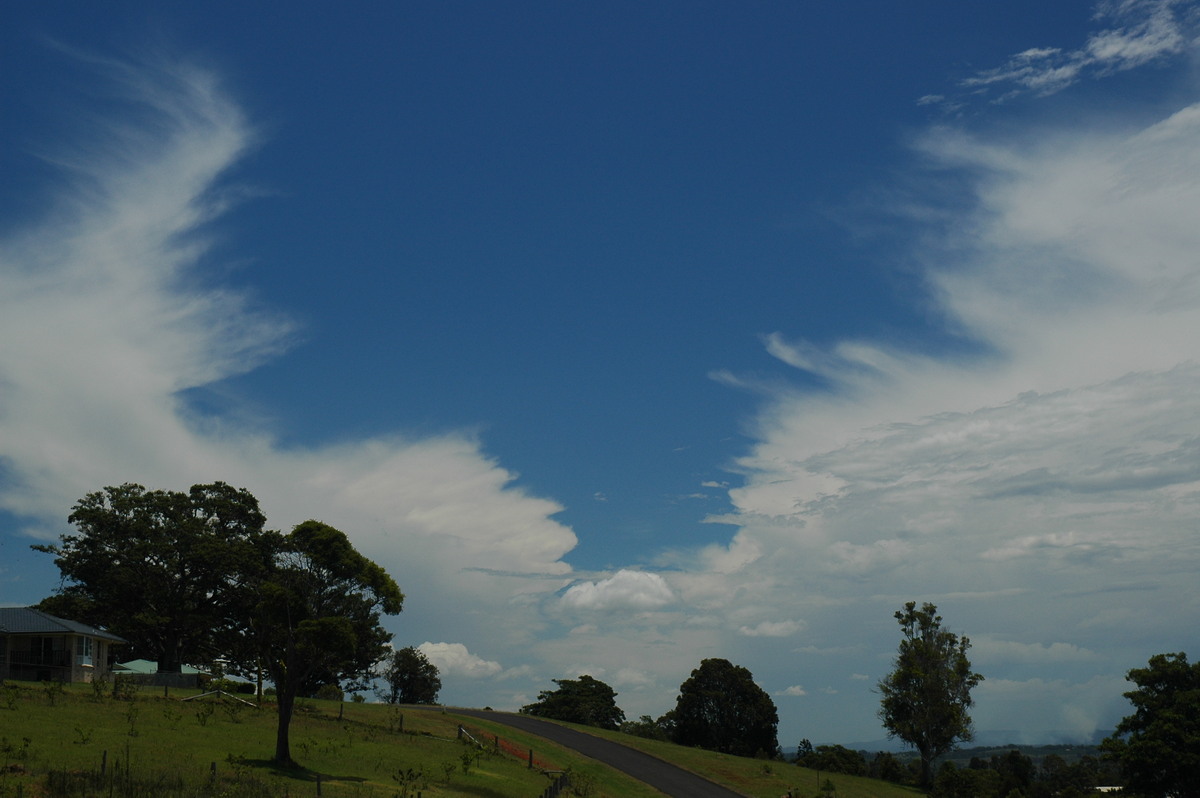
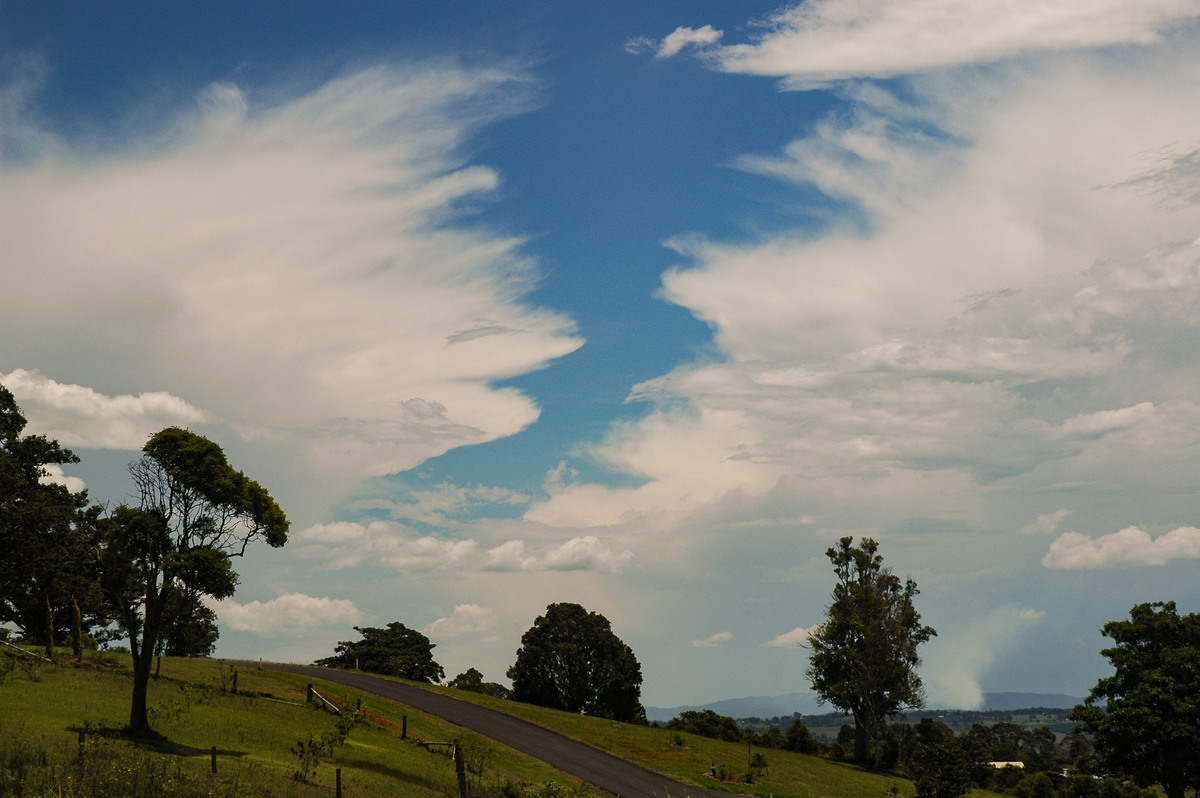
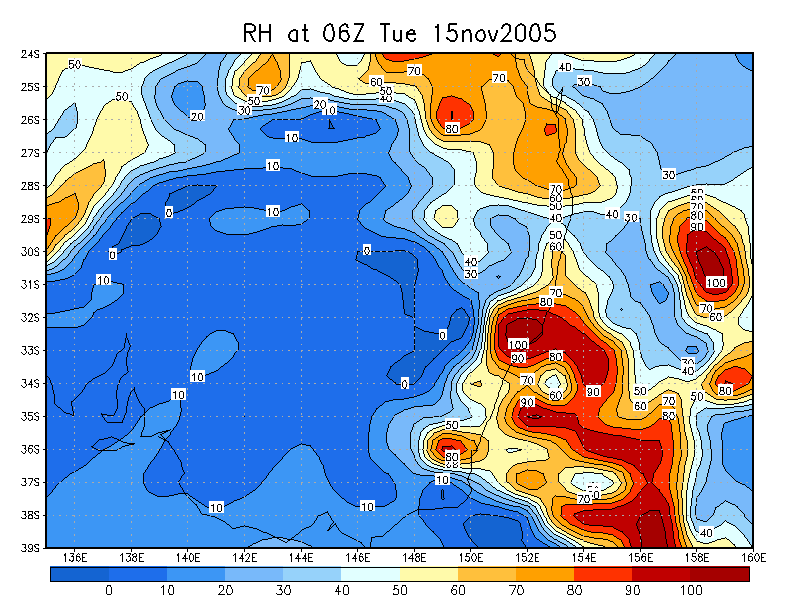
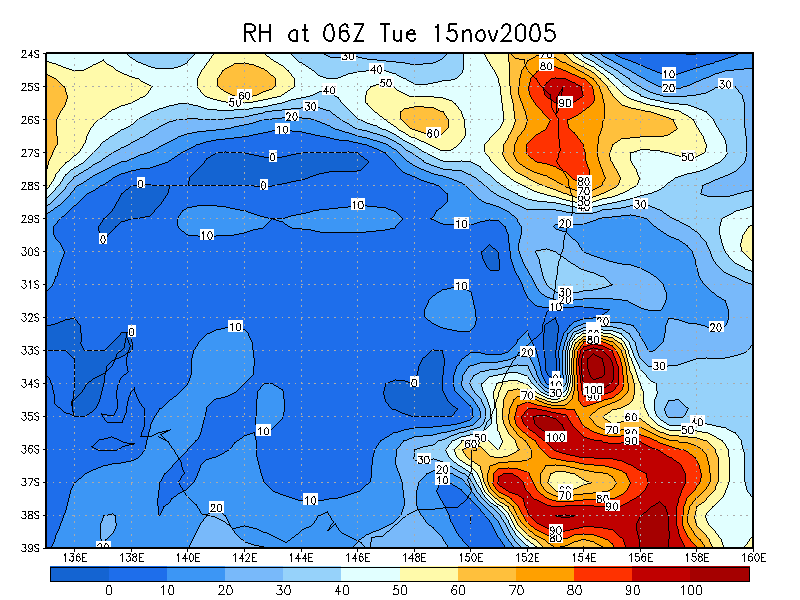
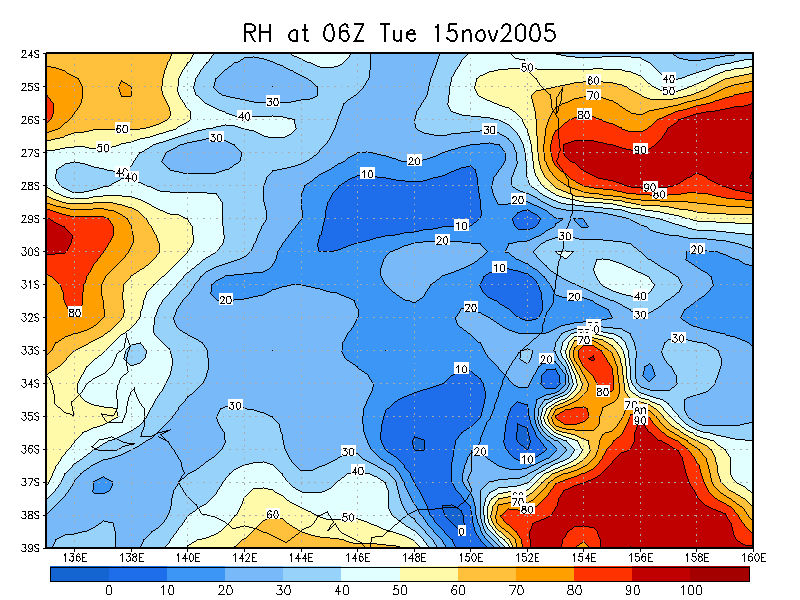
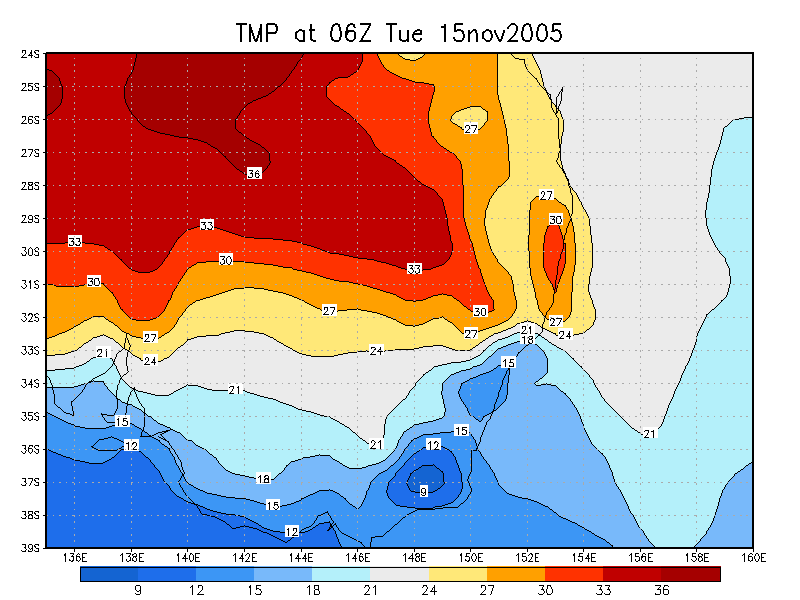
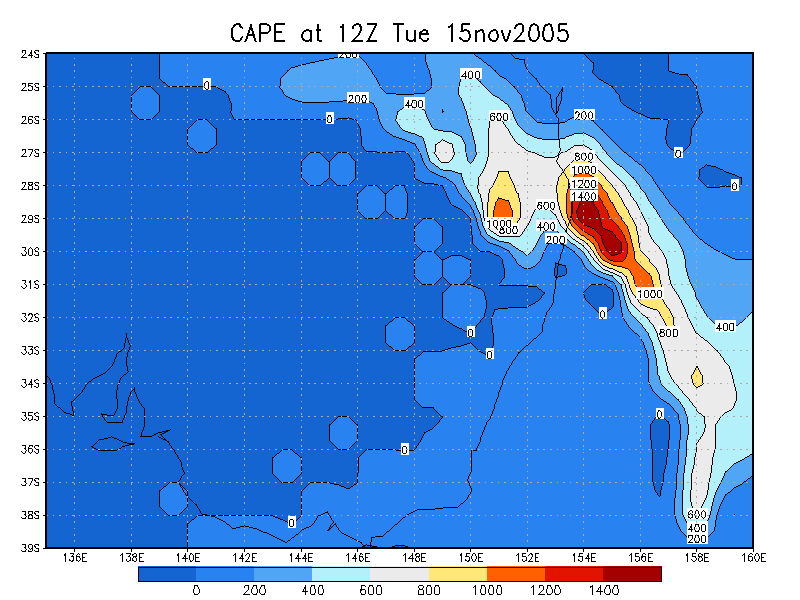
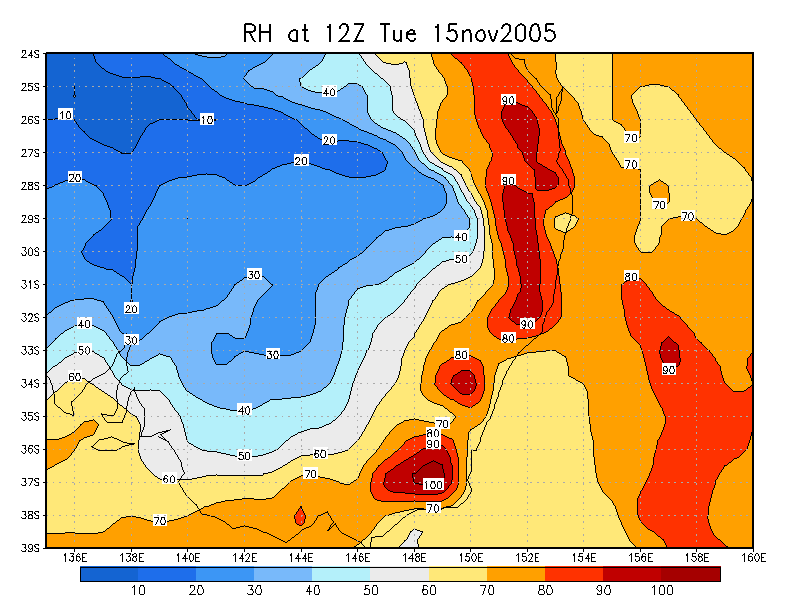
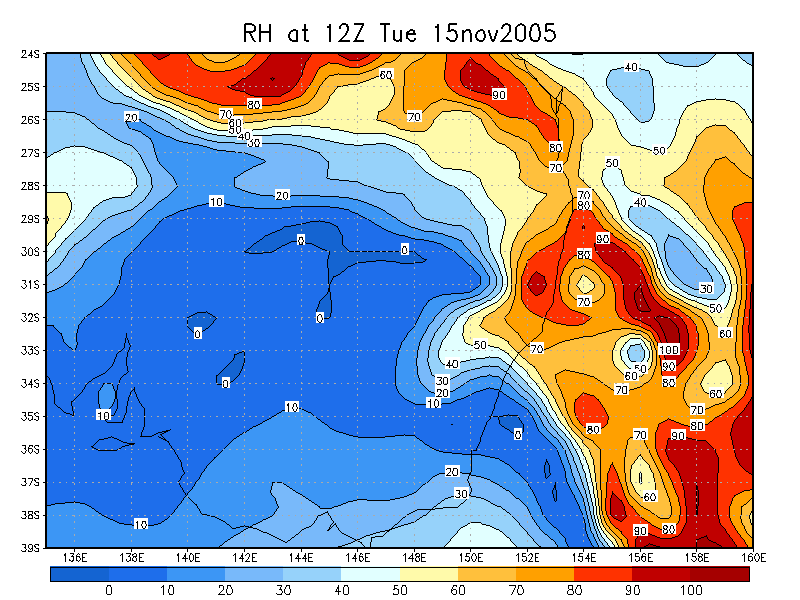
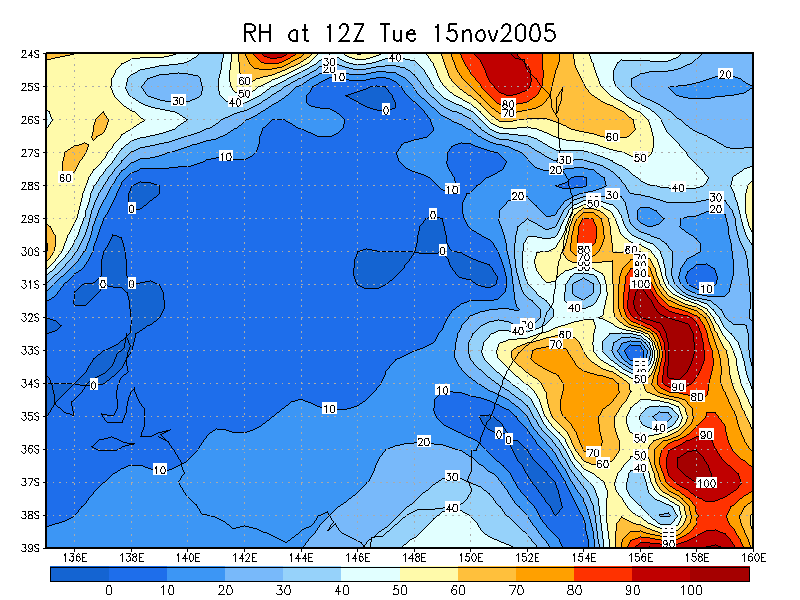
This was a very frustrating day in the Northern Rivers. Loads of potential with great wind shear, good temperature profile but humidity was just too low south of the border to allow anything to develop. The 3pm dew point at Dorrigo of just 8 reflected the situation.
Storms developed on the northern parts of the Northern Tablelands and moved into SE Queensland and Brisbane during the afternoon.
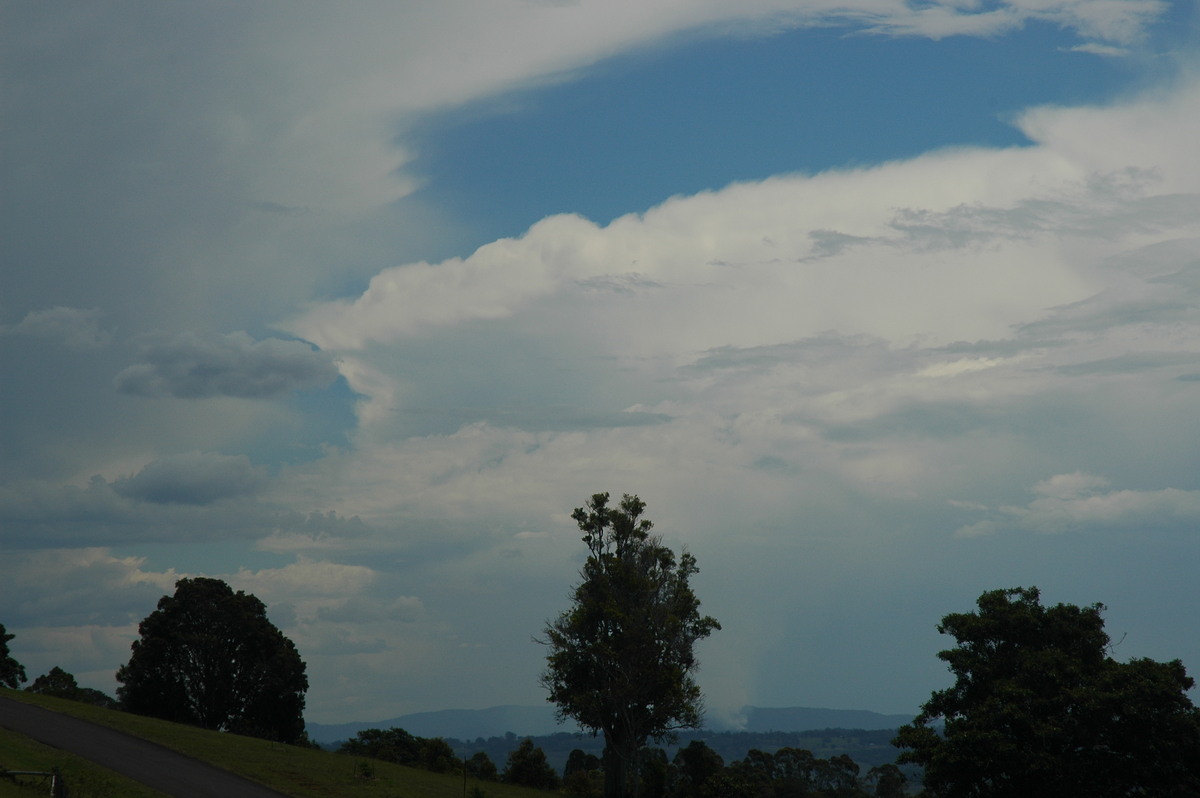
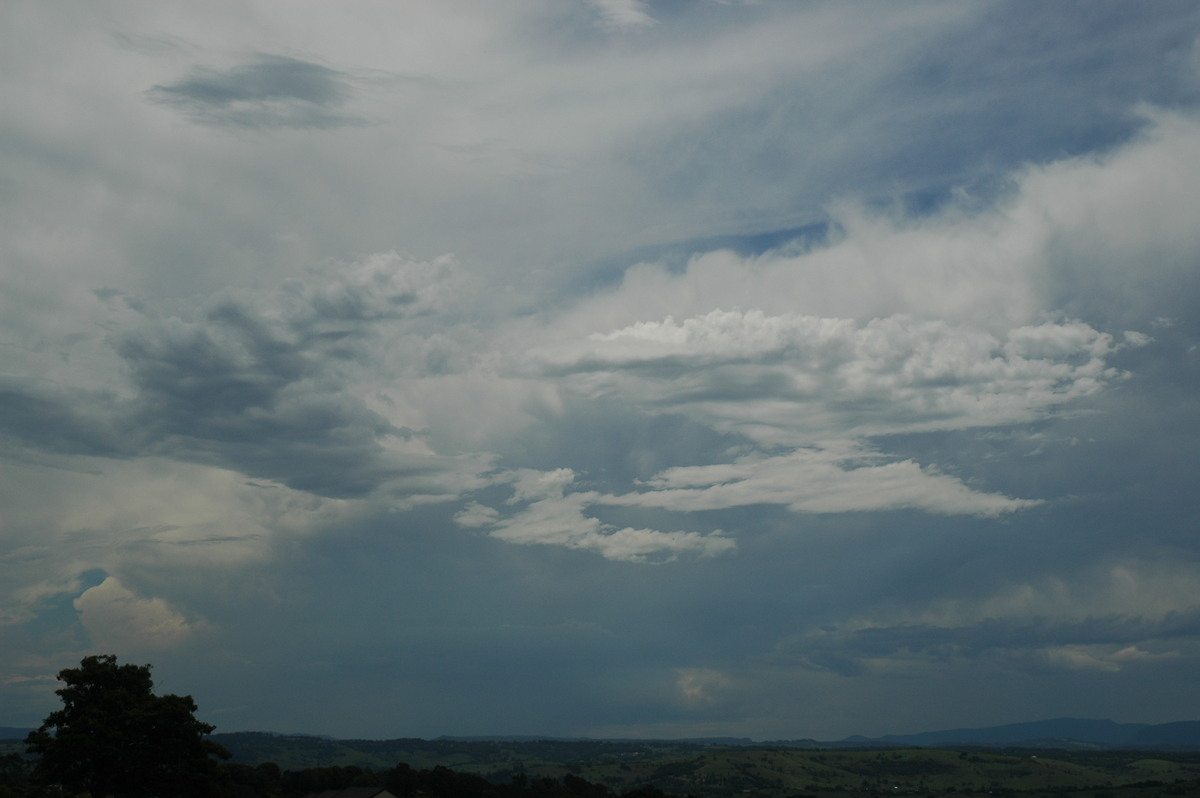
However all was not lost as conditions were more favourable for the evening. A surface trough and cold front was moving quickly up the NSW coast and storms were active along it.
At 8pm it all looked too distant and I thought it may pass too far off the coast. A little later, radar showed new cells forming close to the coast so it was time to head off. Rodney Wallbridge arrived at my place and we headed to North Wall at Ballina.
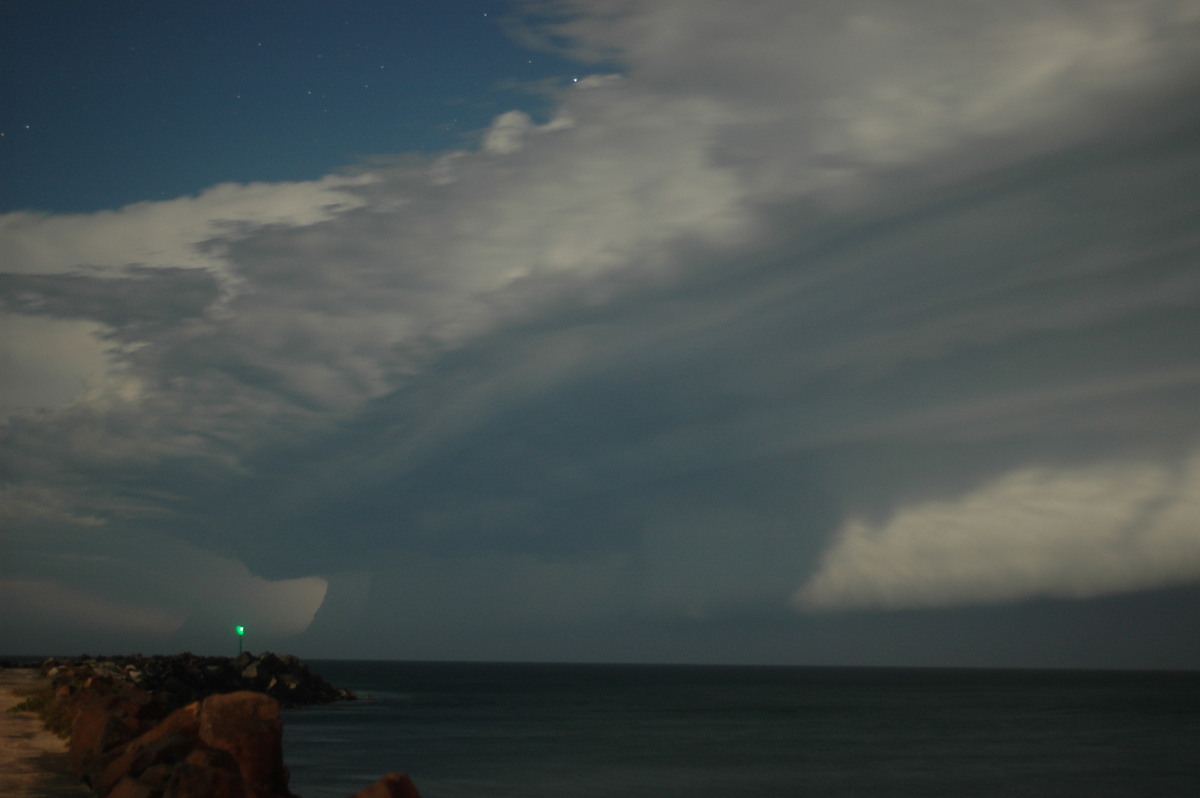
Lightning was continuous but almost all of it was in-cloud. The scene at the mouth of the Richmond River was great after a non-event chase day. The full moon illuminated the fast moving clouds nicely. Dave Ellem met up with us soon after we arrived.
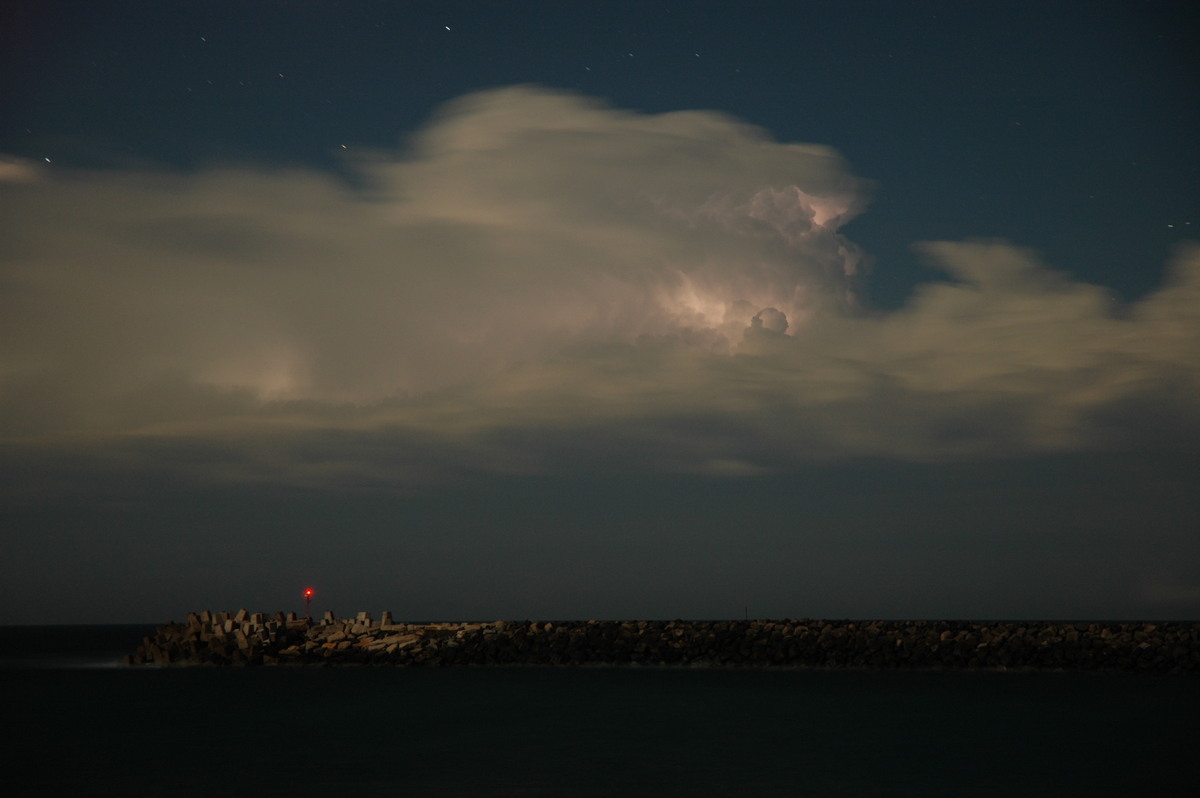
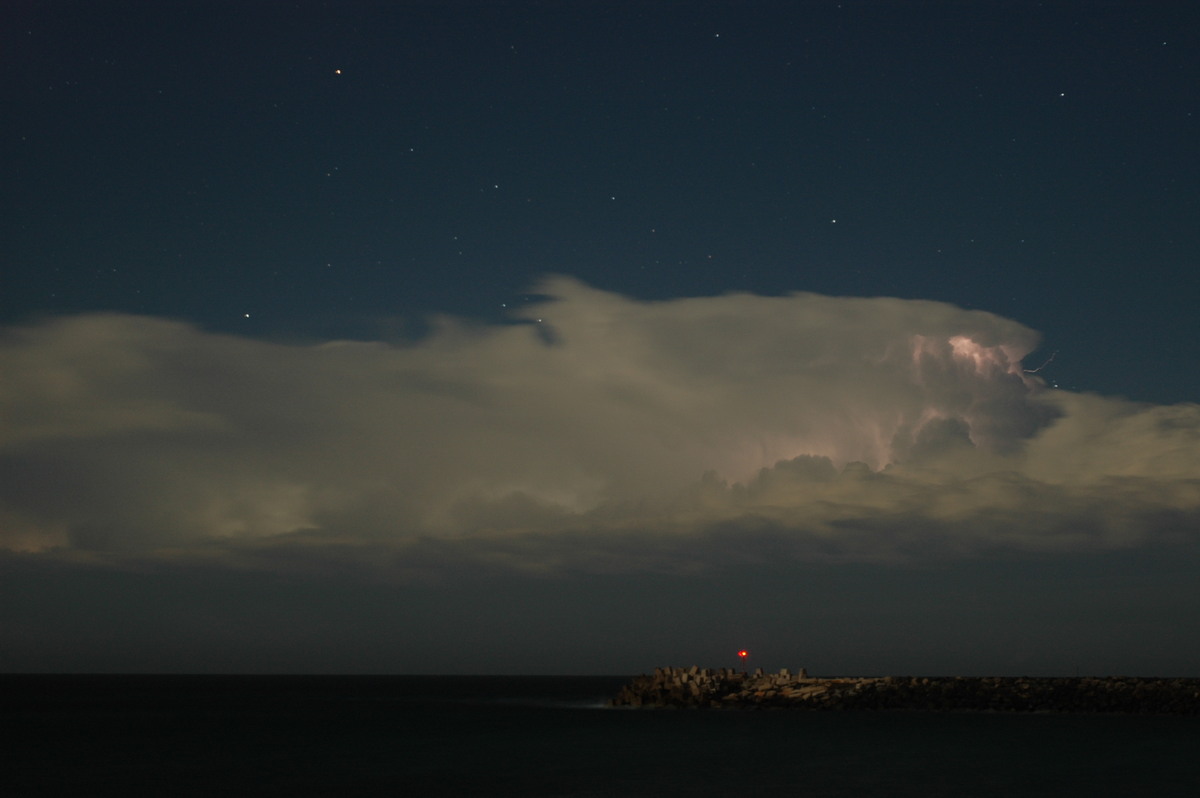
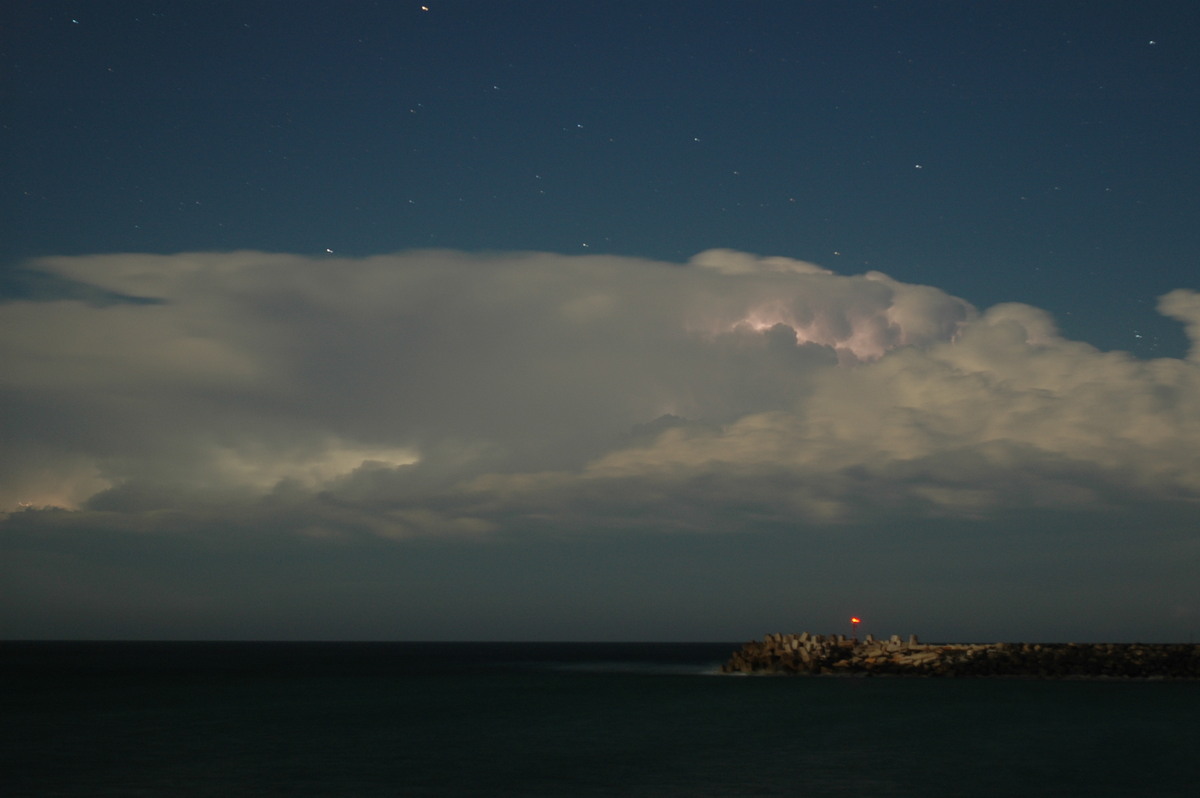
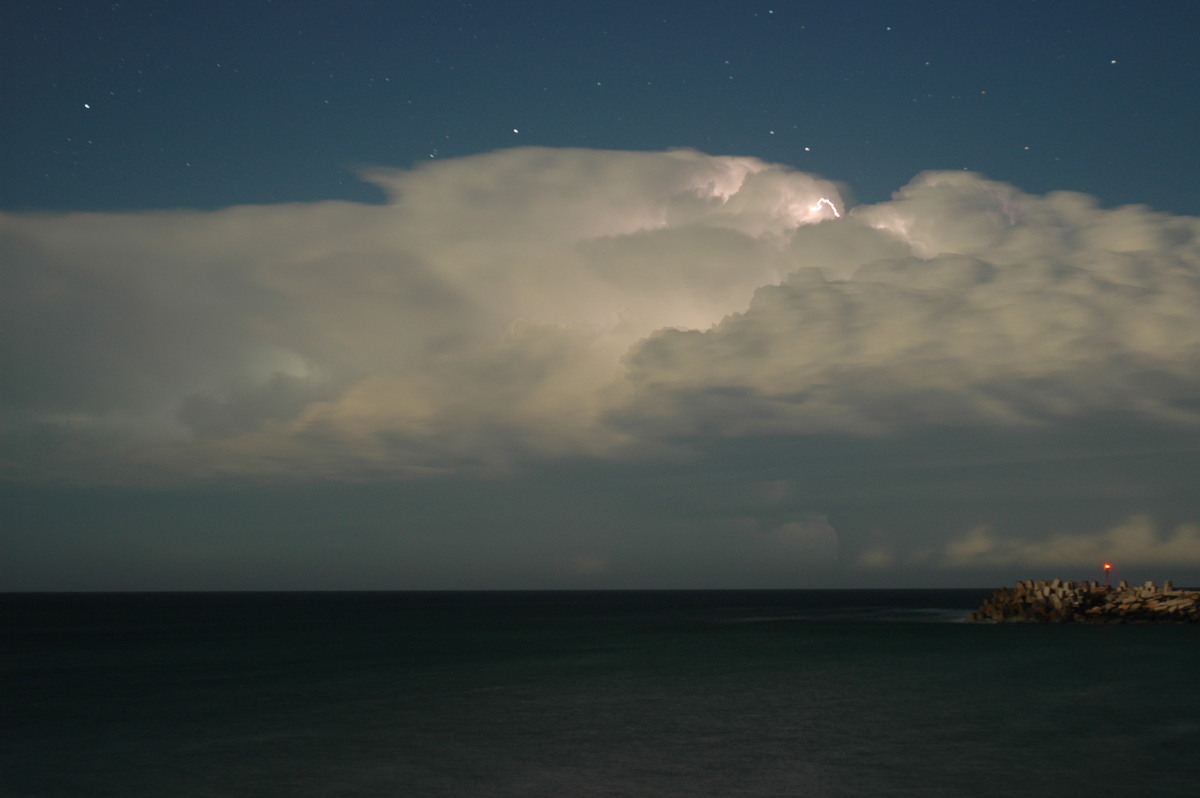
Some quite dramatic and unusual cloud structures were captured as the line of activity approached. Although precipitation from the storms was well out to sea, the shelf and roll cloud structures extended back over the land south of Ballina.
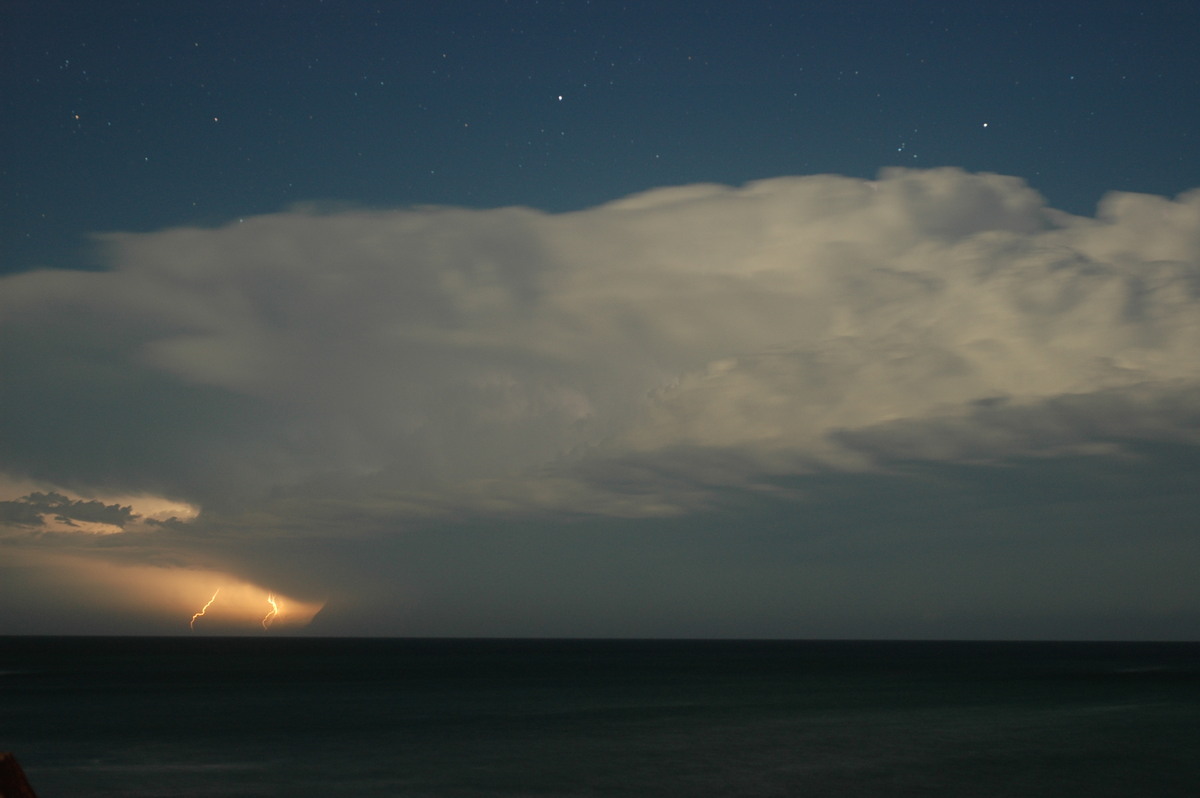
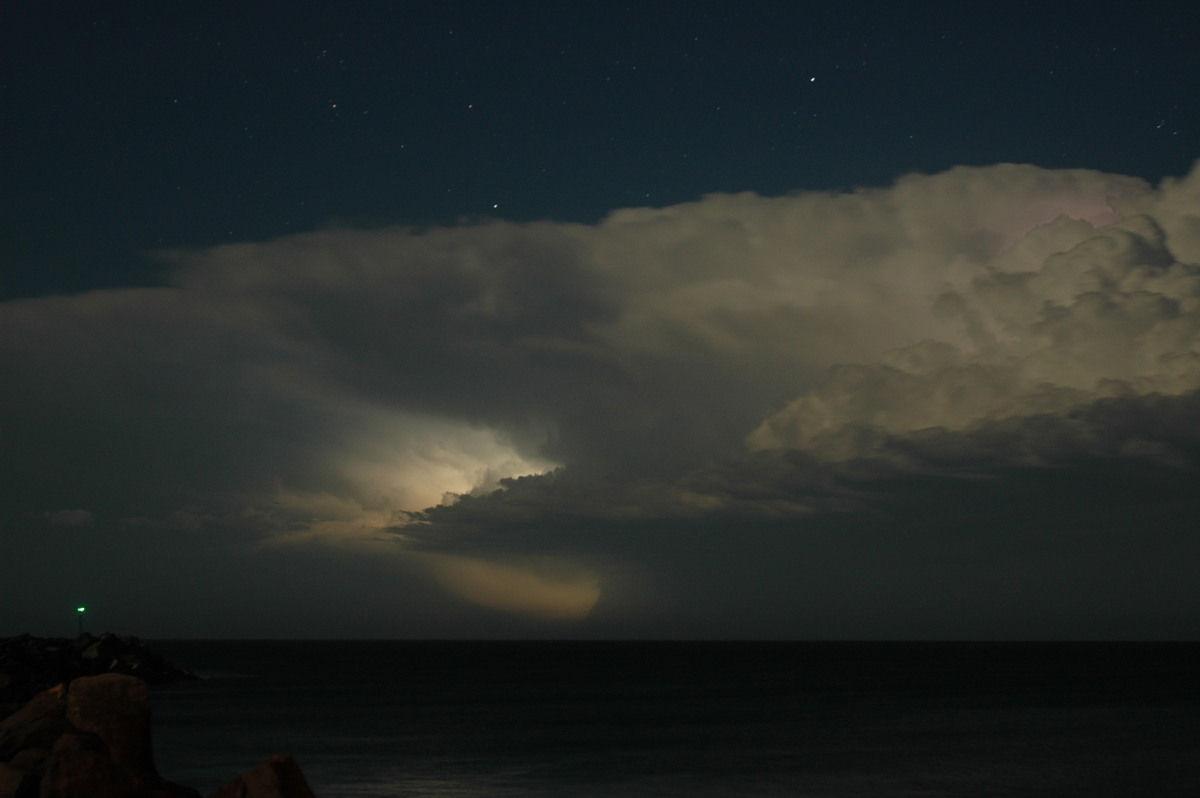
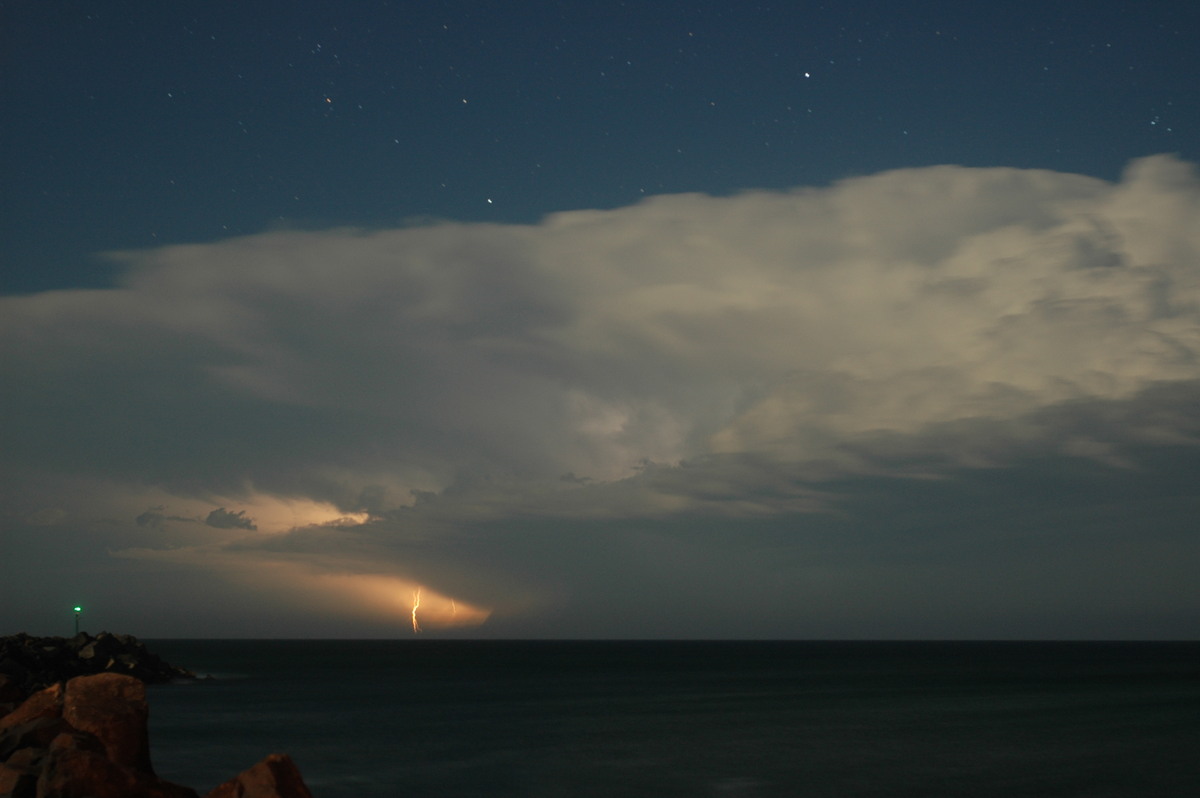
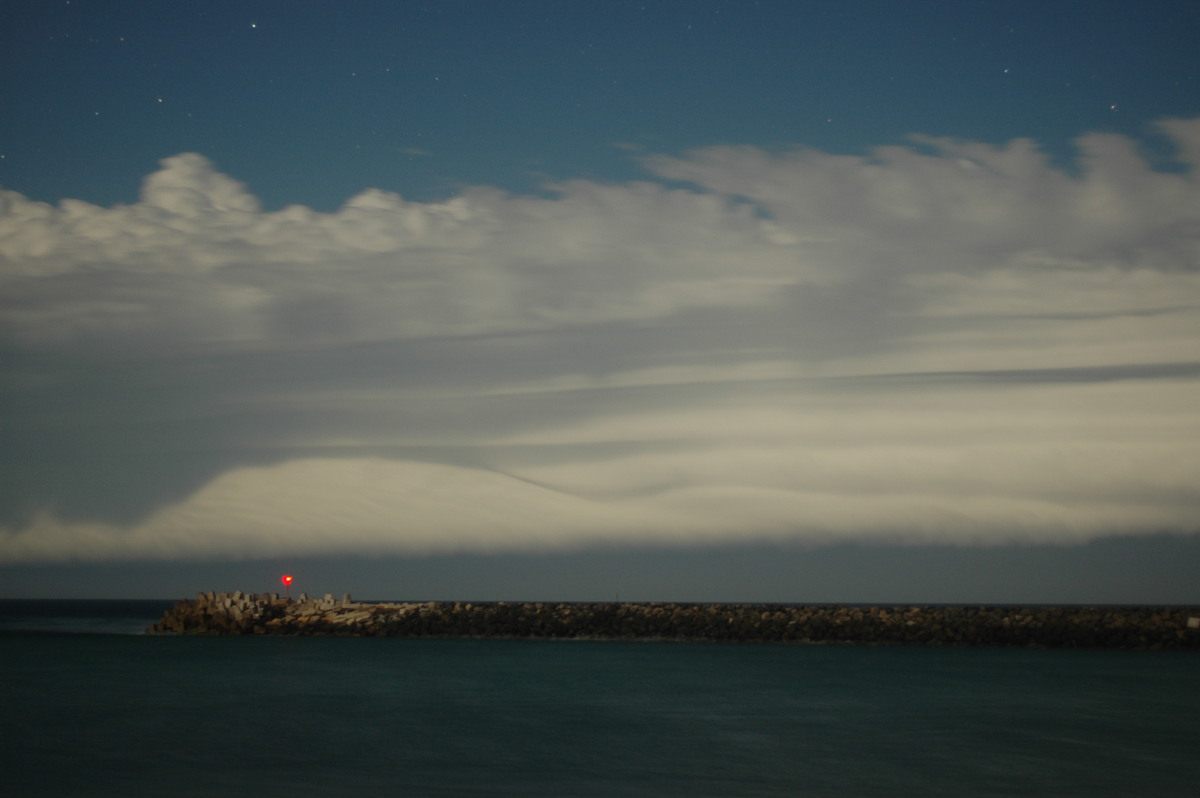
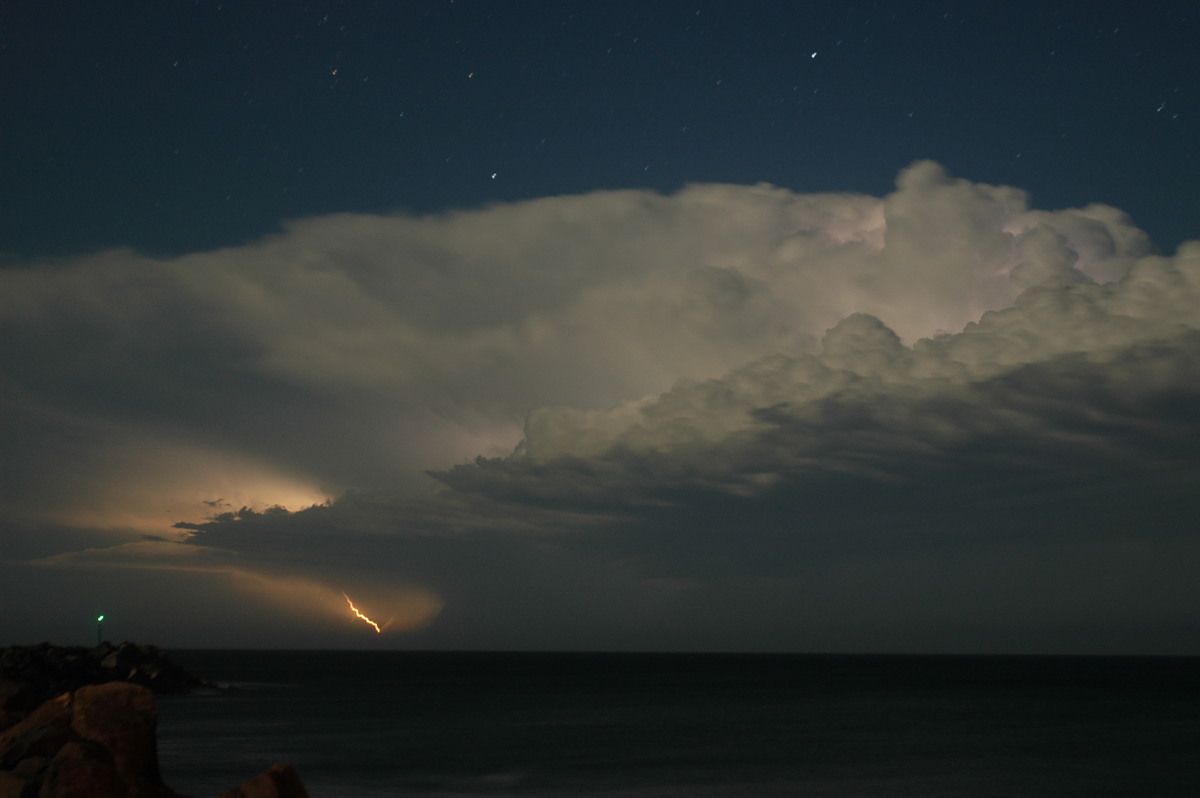
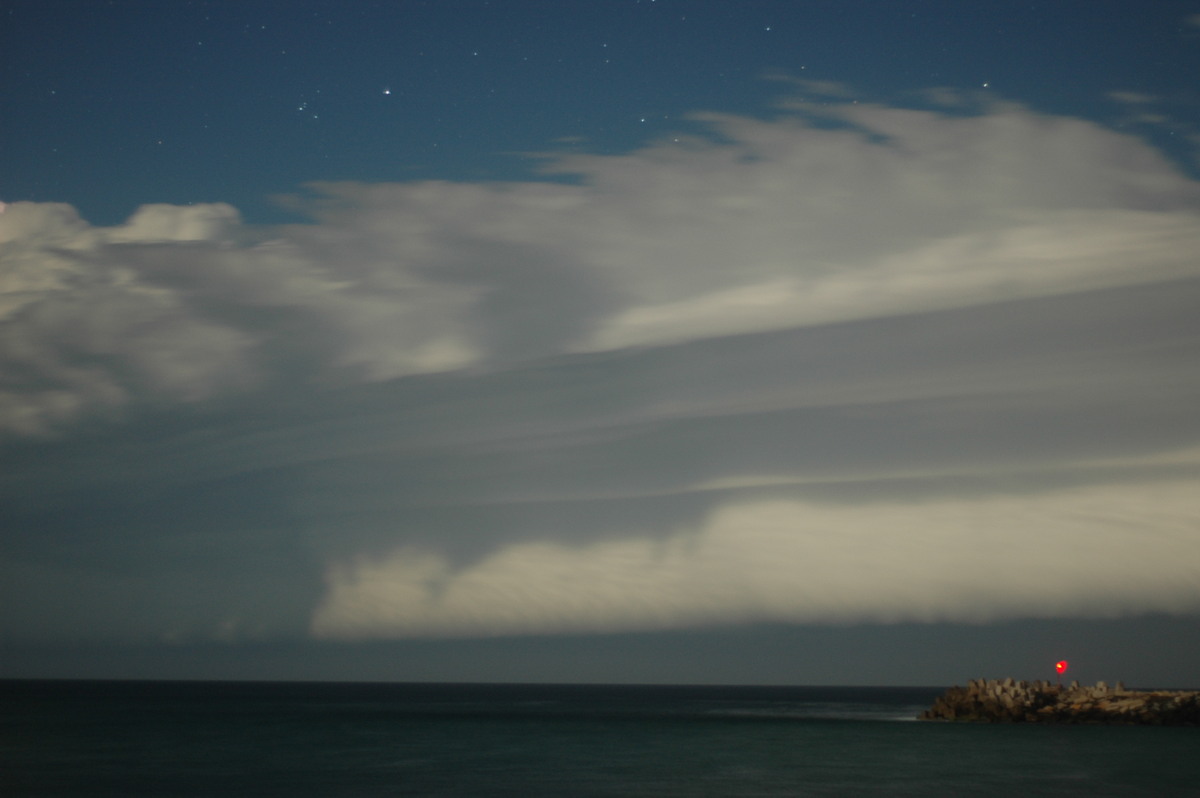
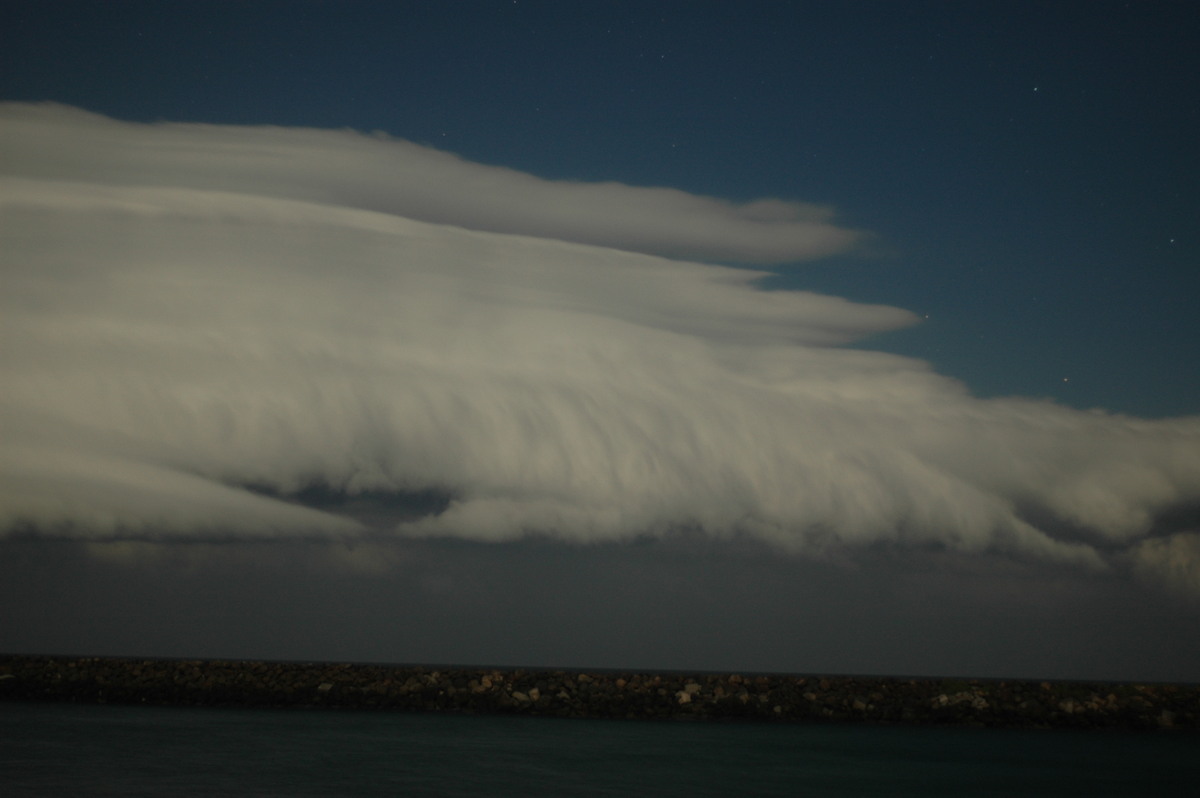
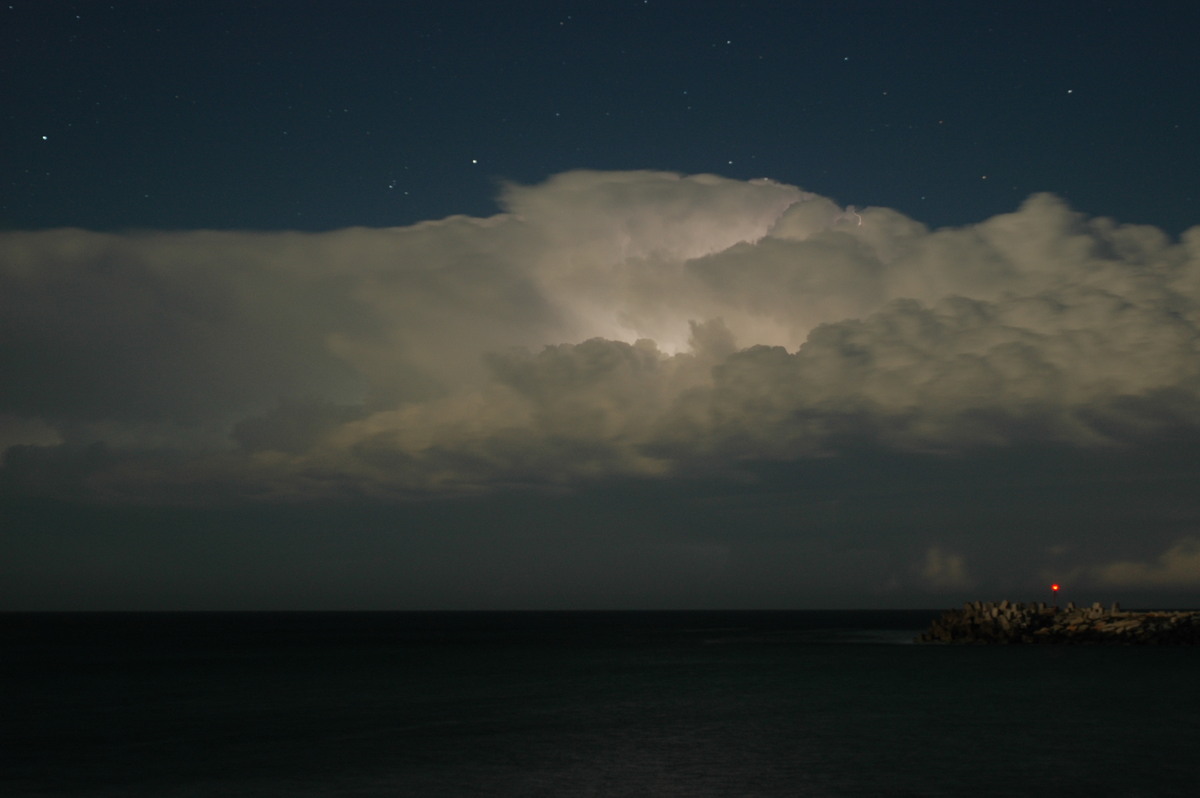
By 10.30pm the storm and cloud structures were quite amazing ! With the lightning and full moon light, it made for some spectacular photos.
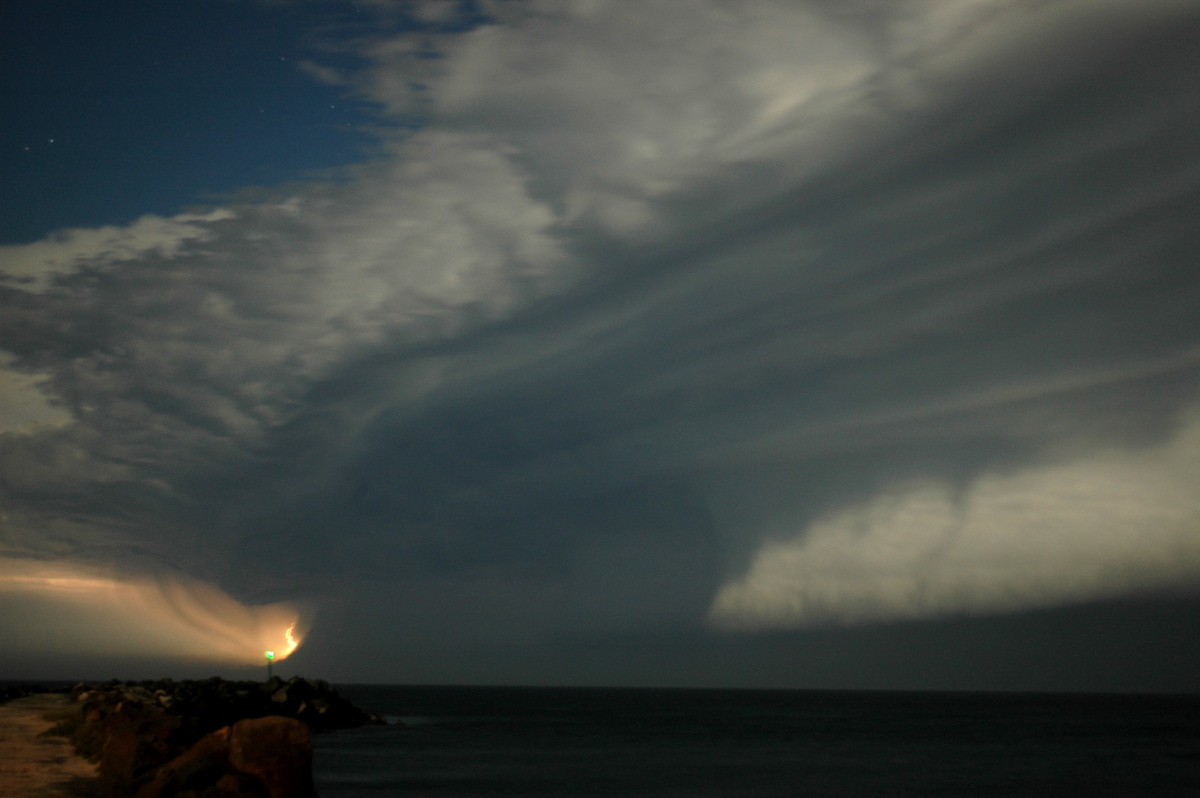
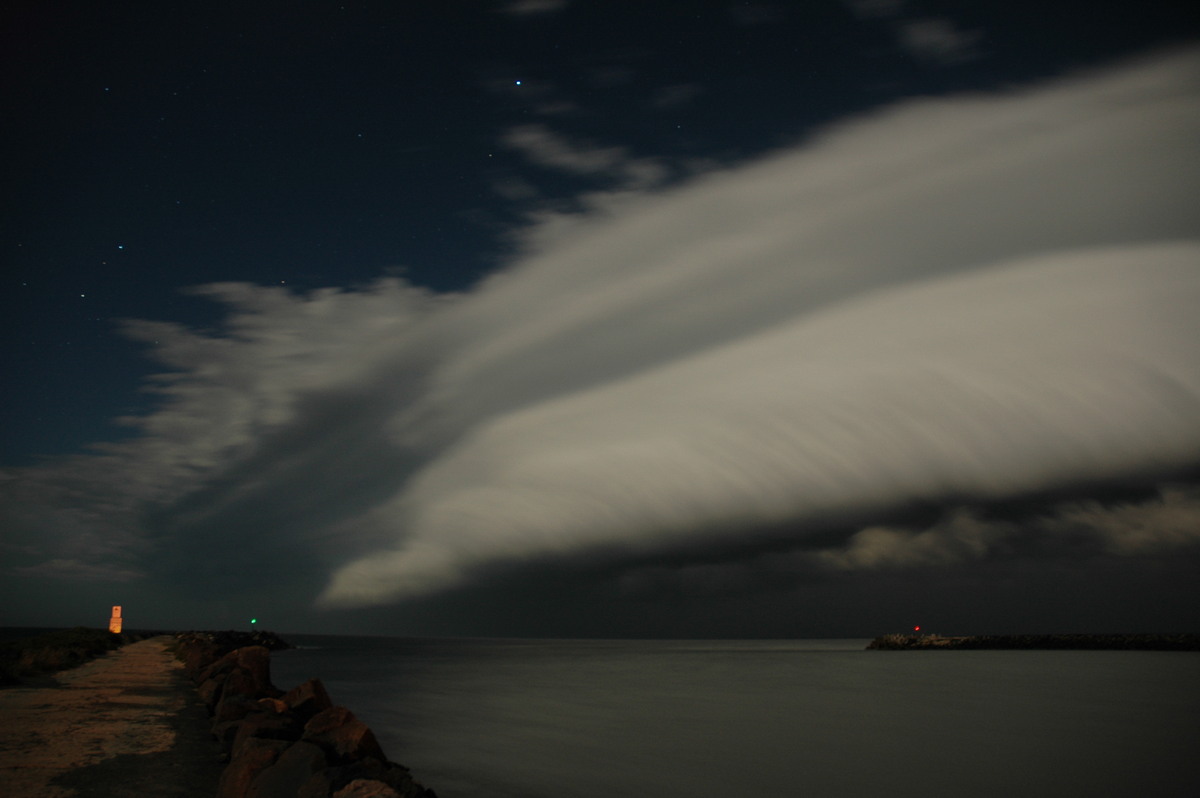
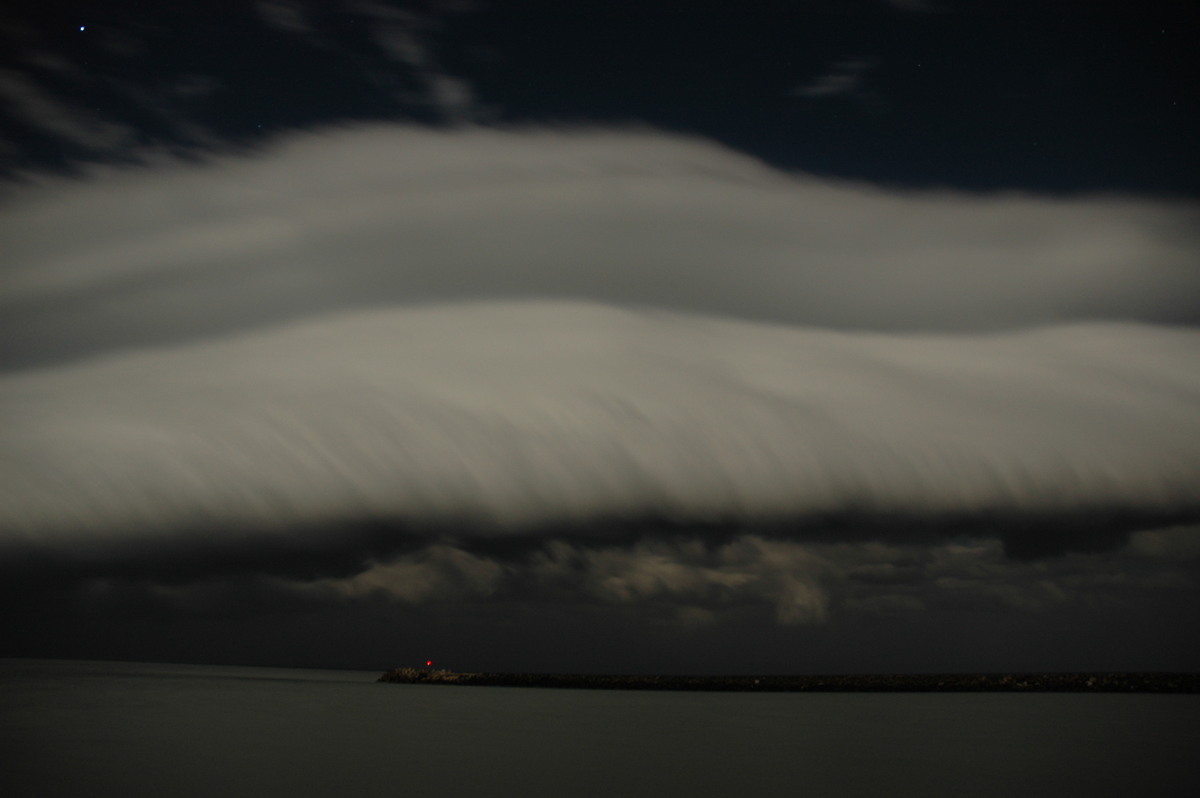
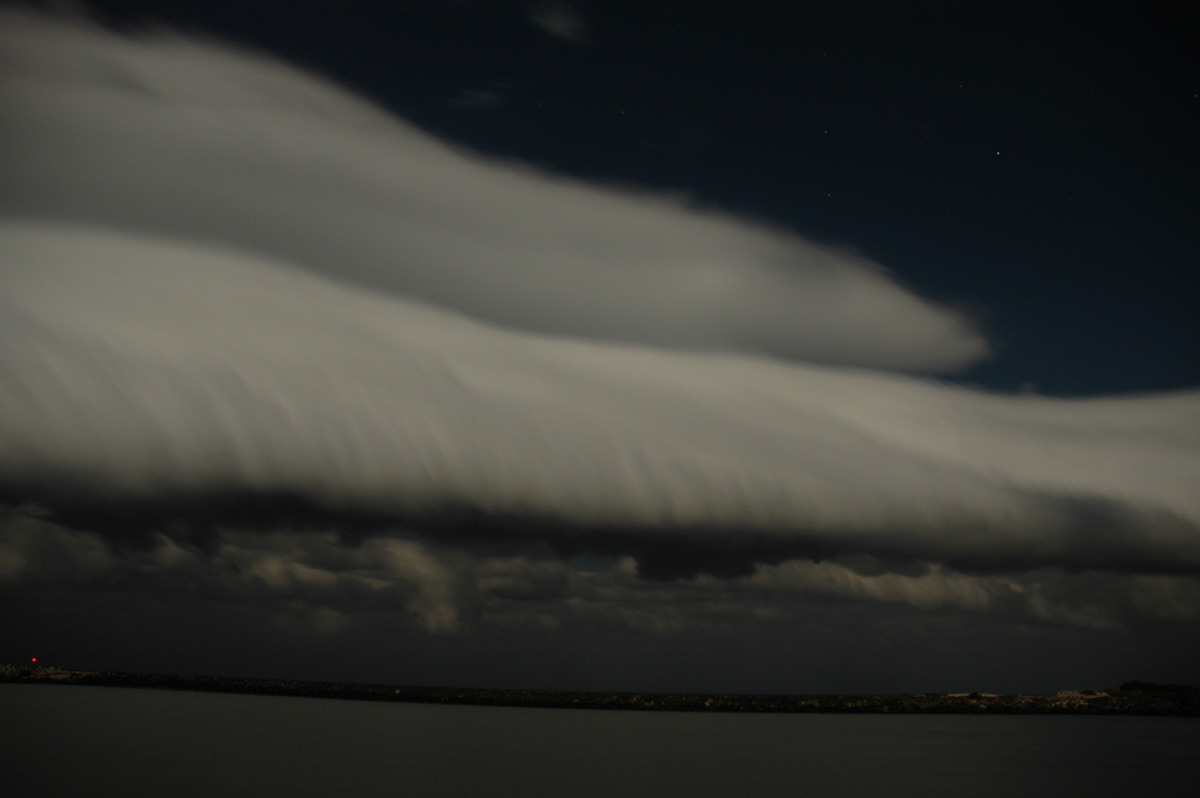
The shelf cloud passed right overhead at 10.45pm when we were blasted by gale force southerlies from the change.
From Bureau of Meteorology
 7pm to 1am local
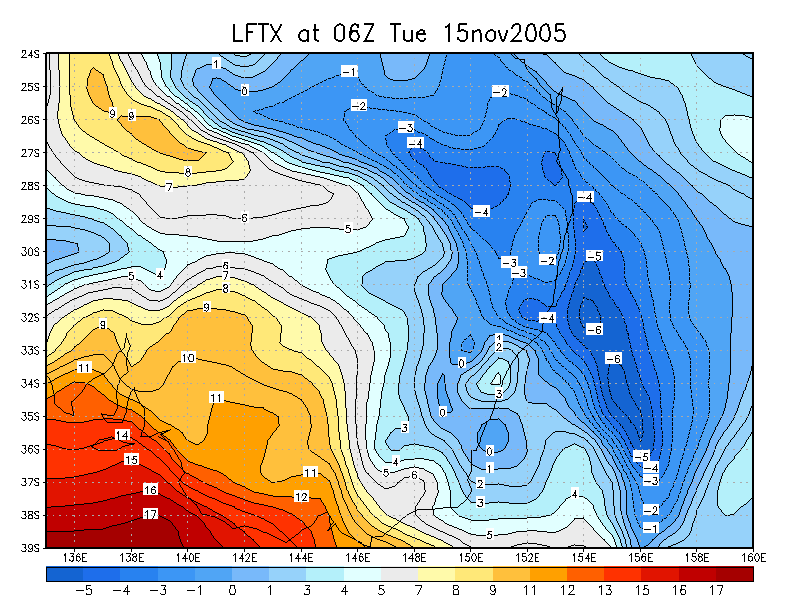
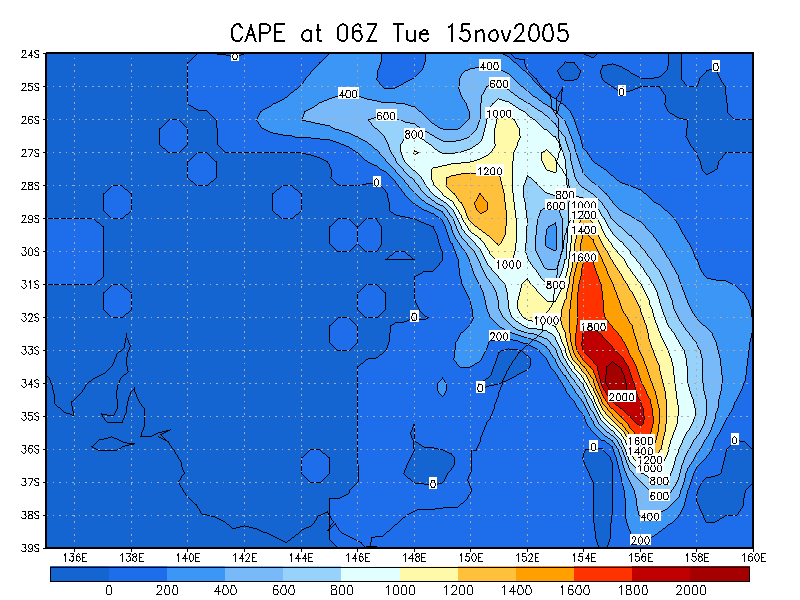
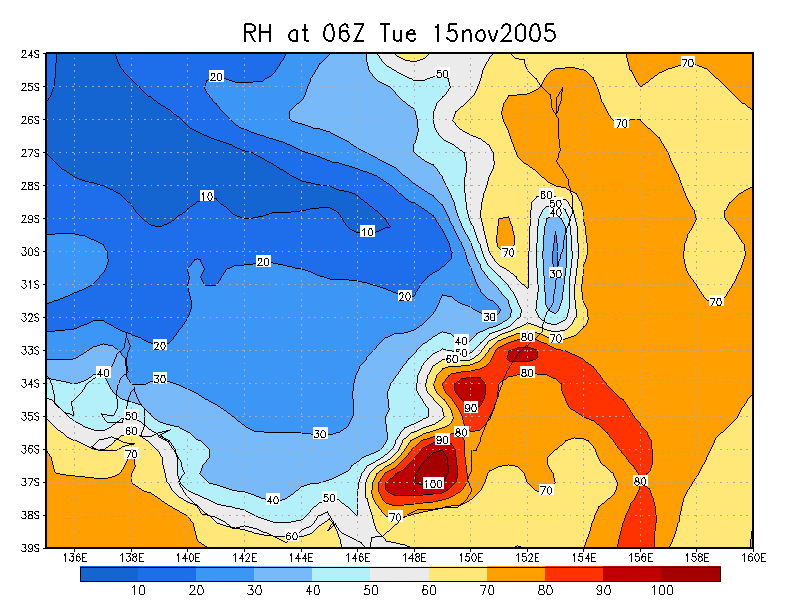
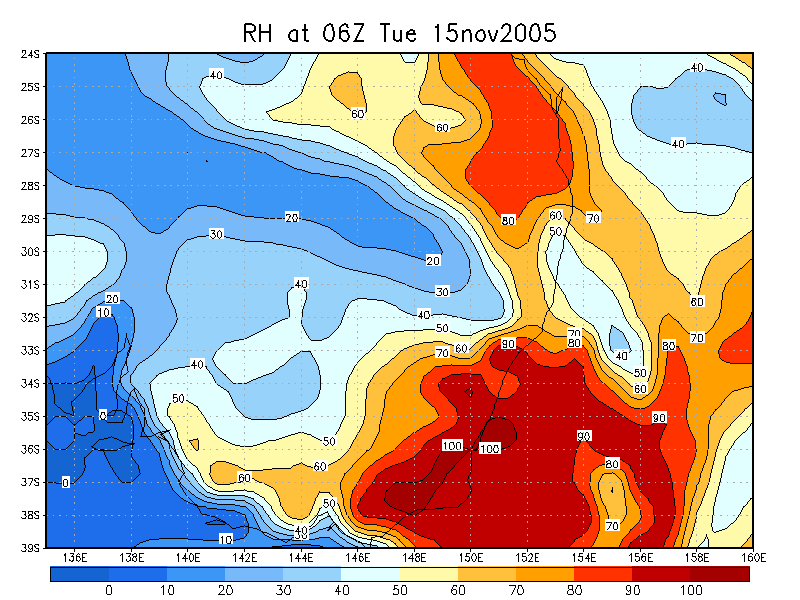
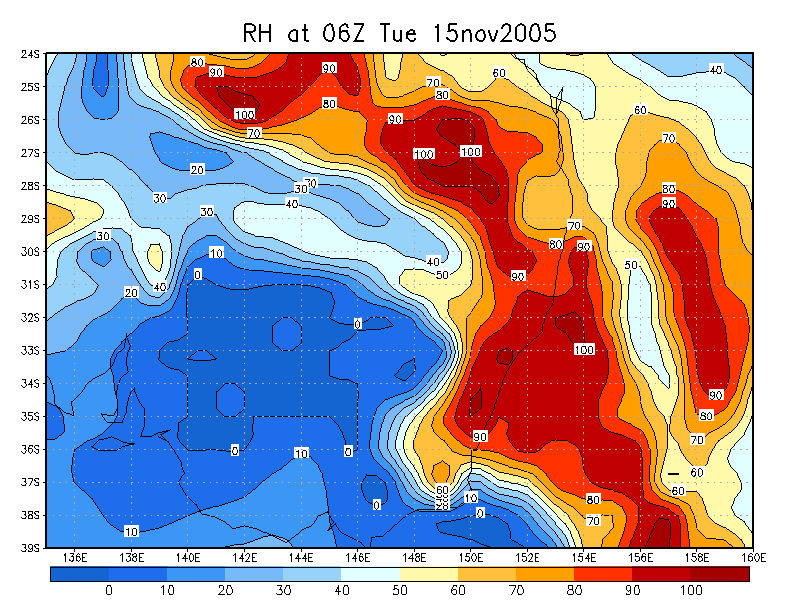
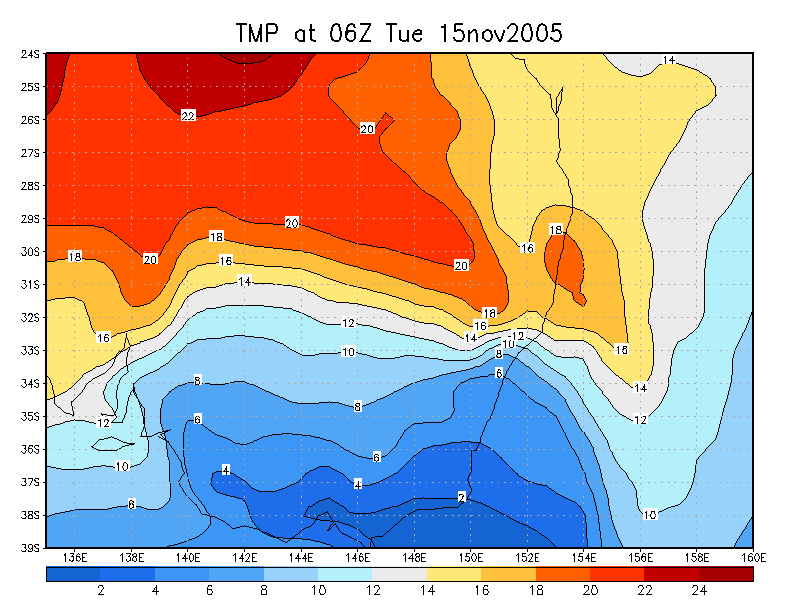
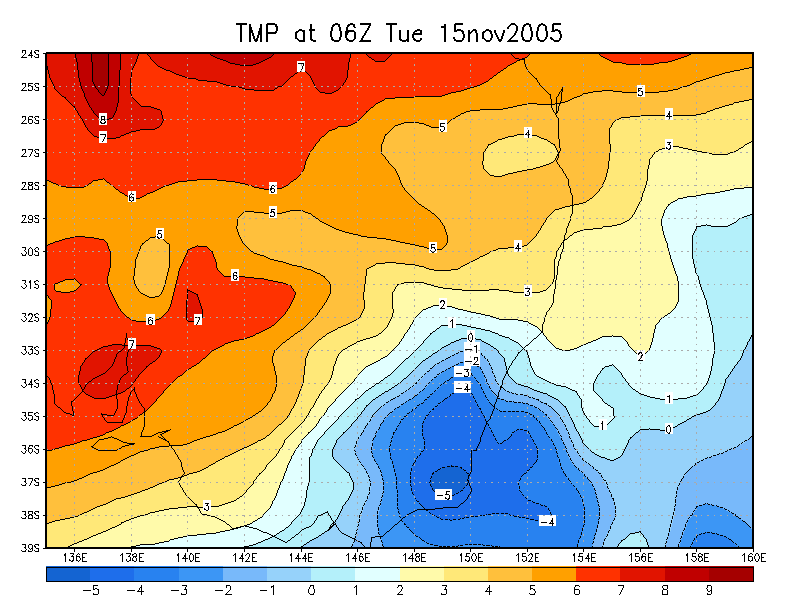
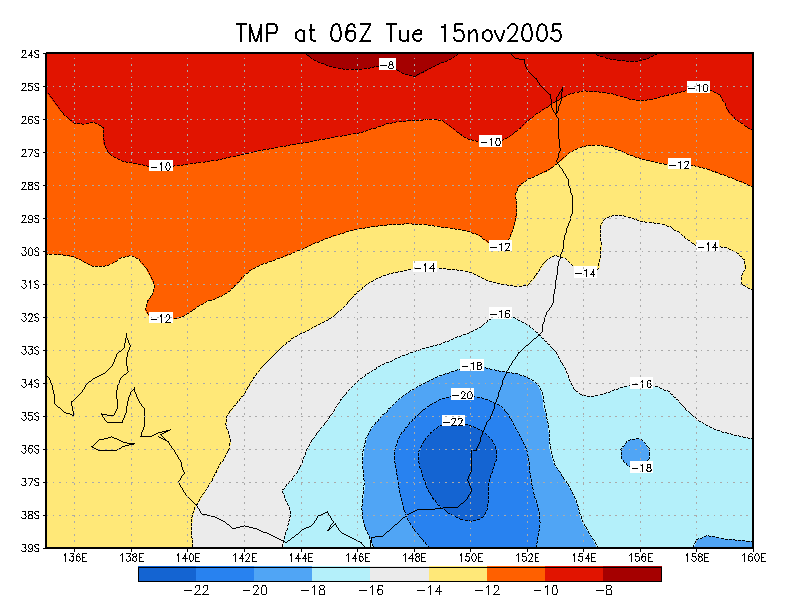
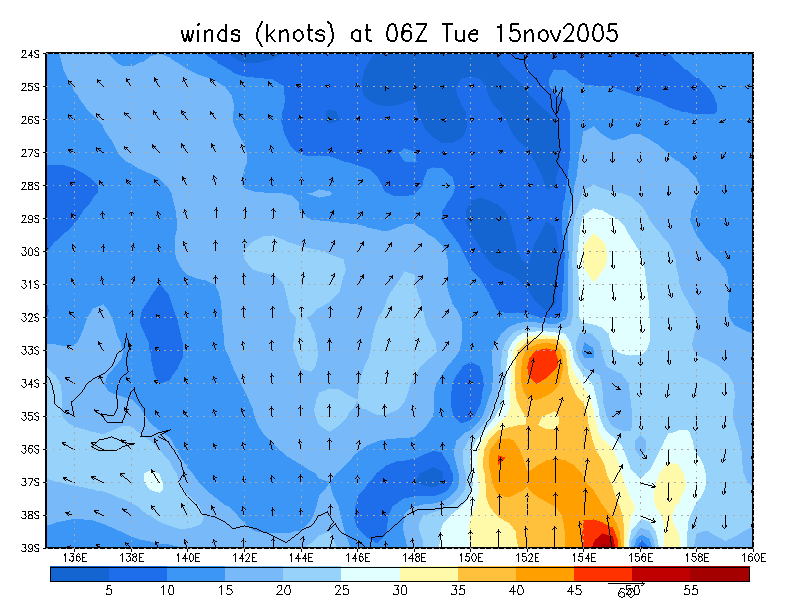
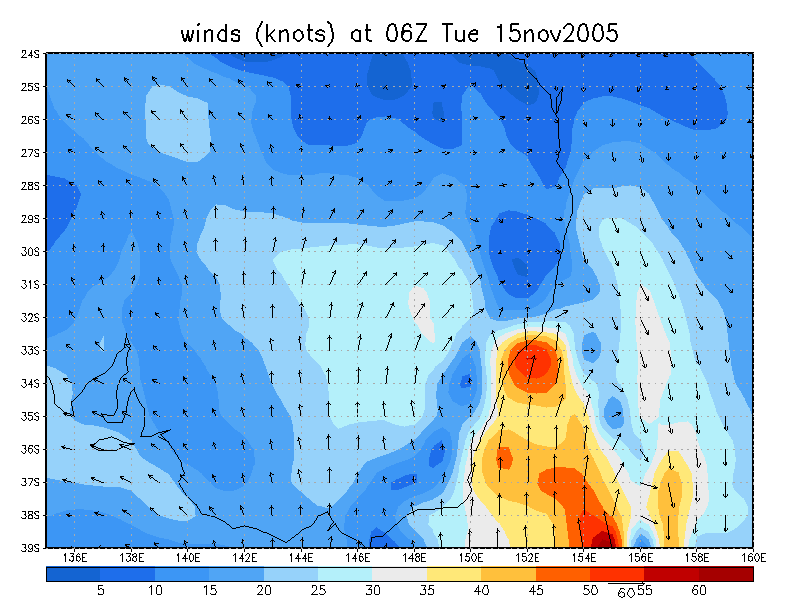
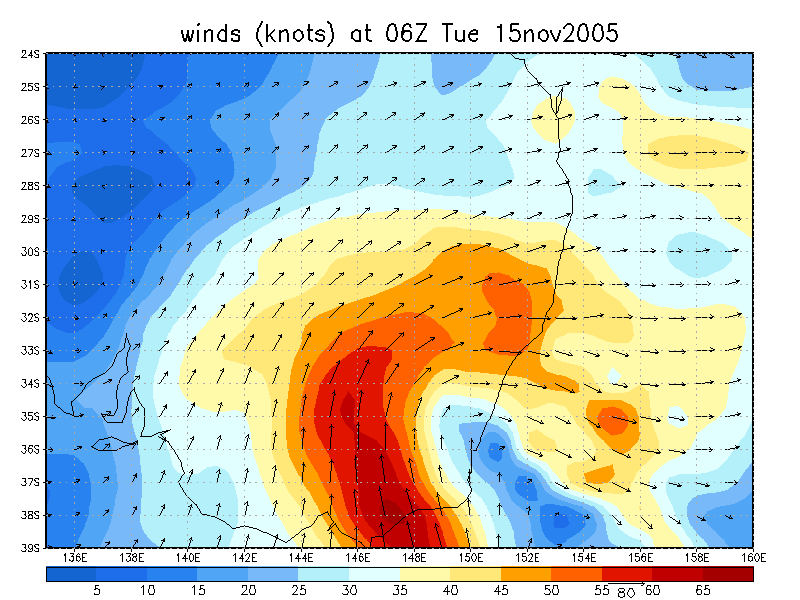
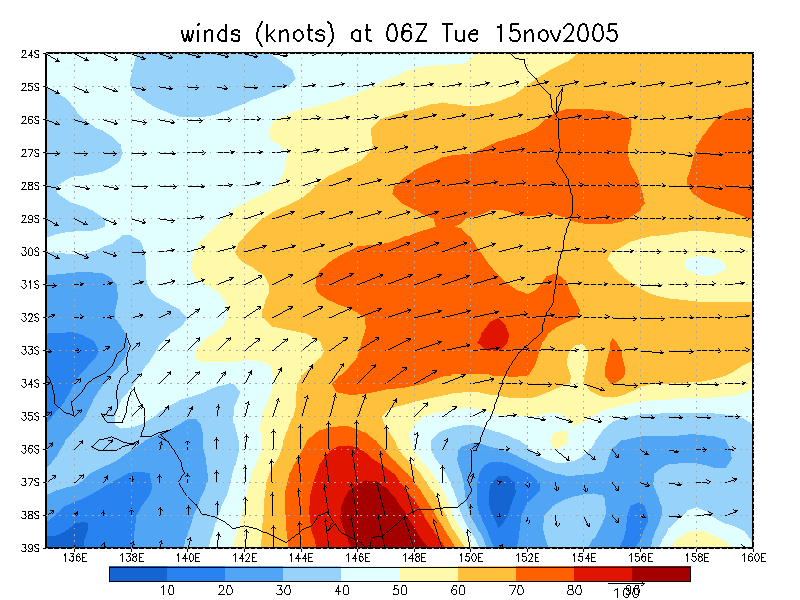
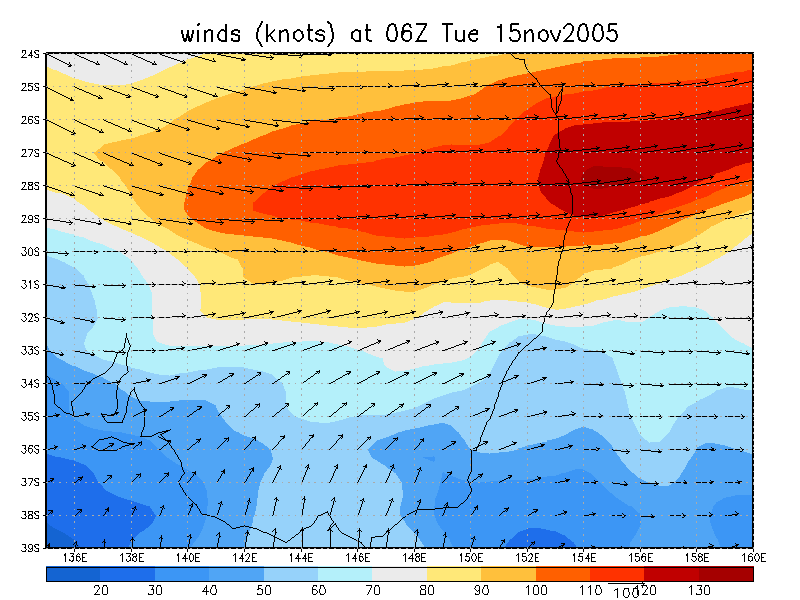
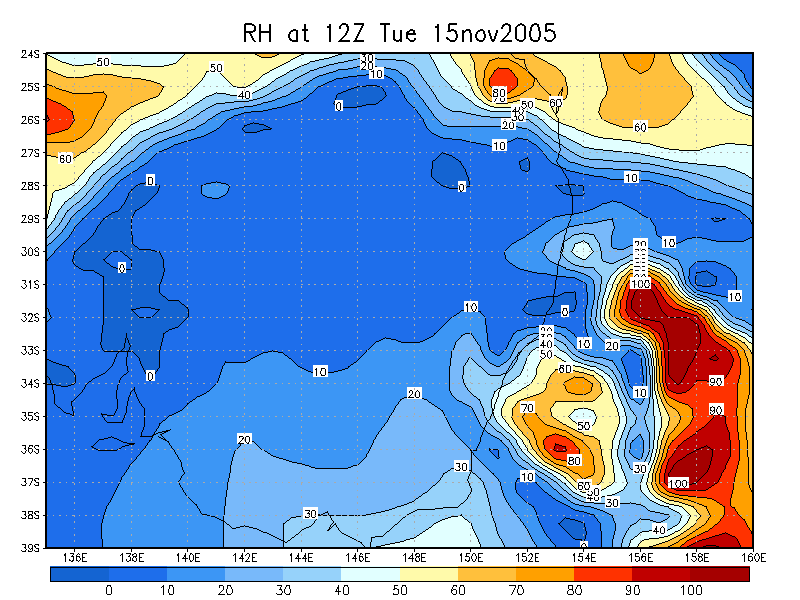
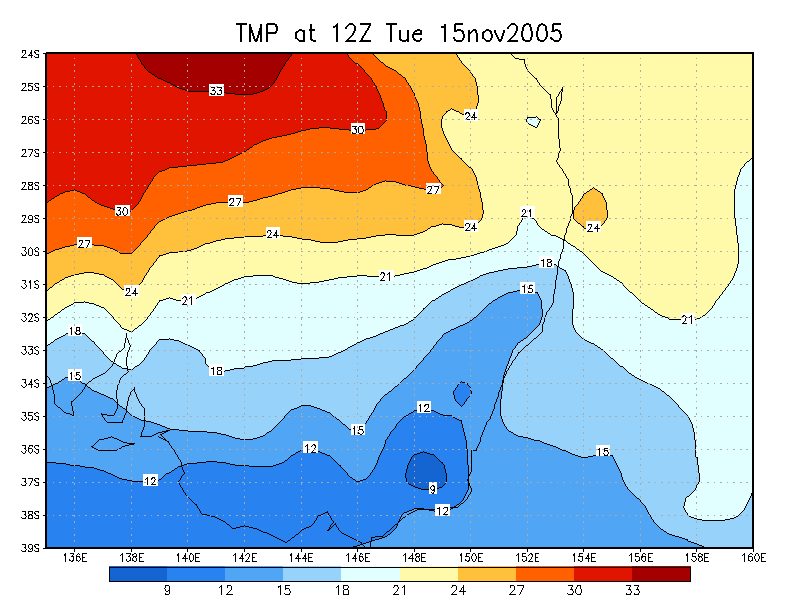
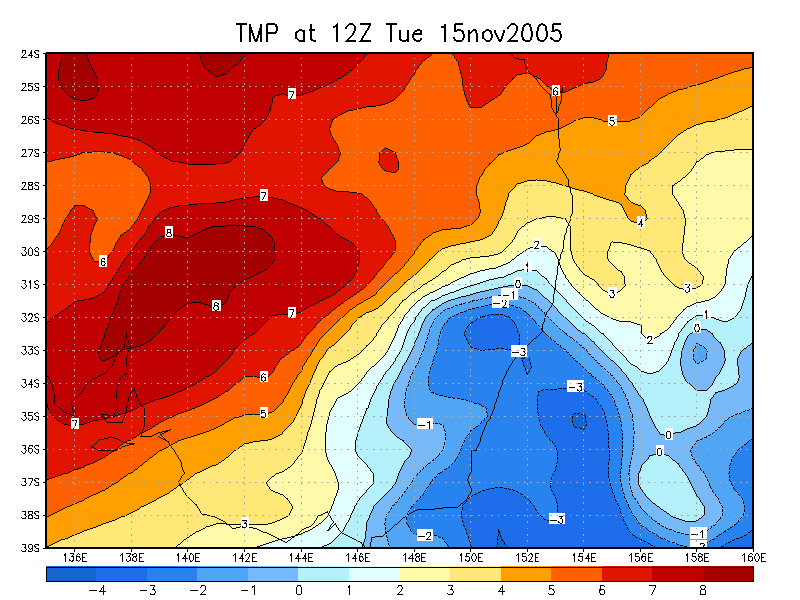
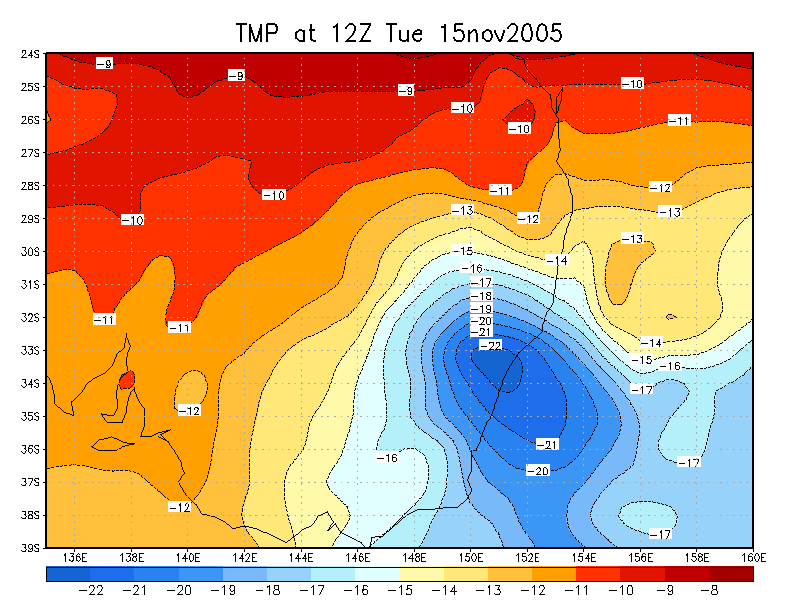
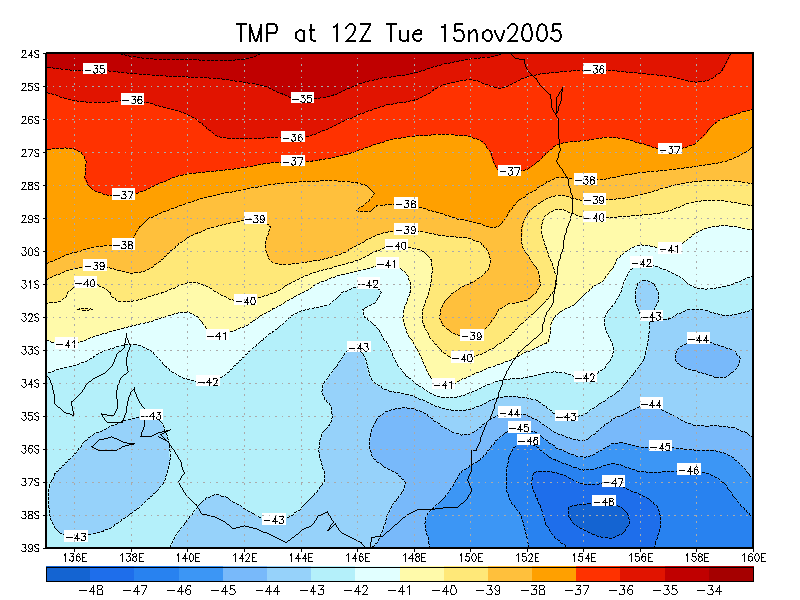
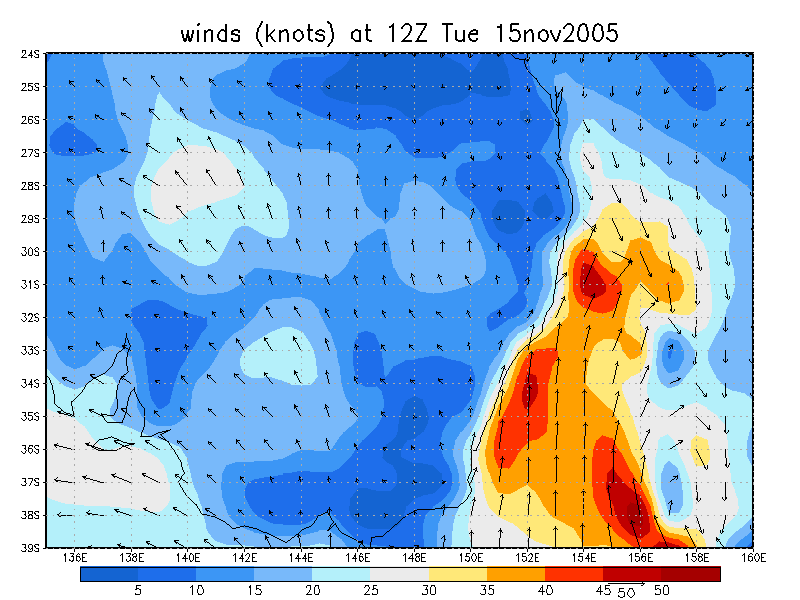
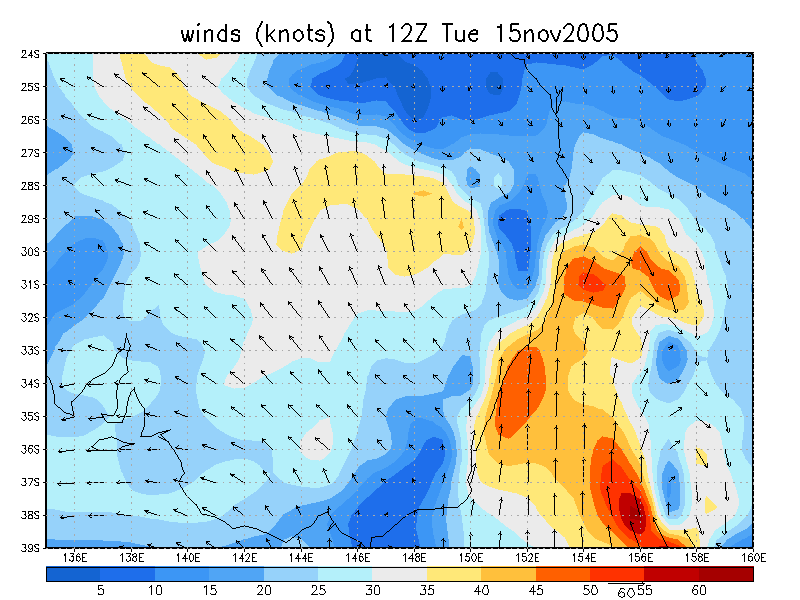
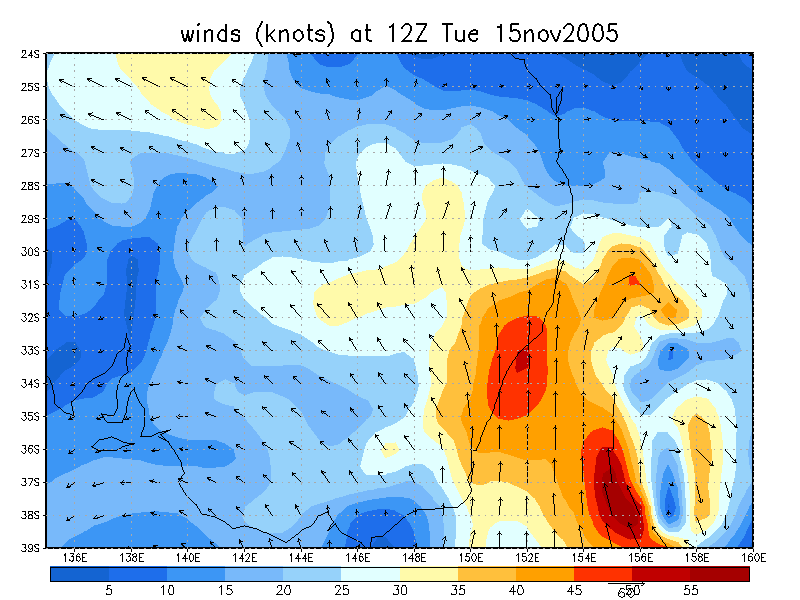
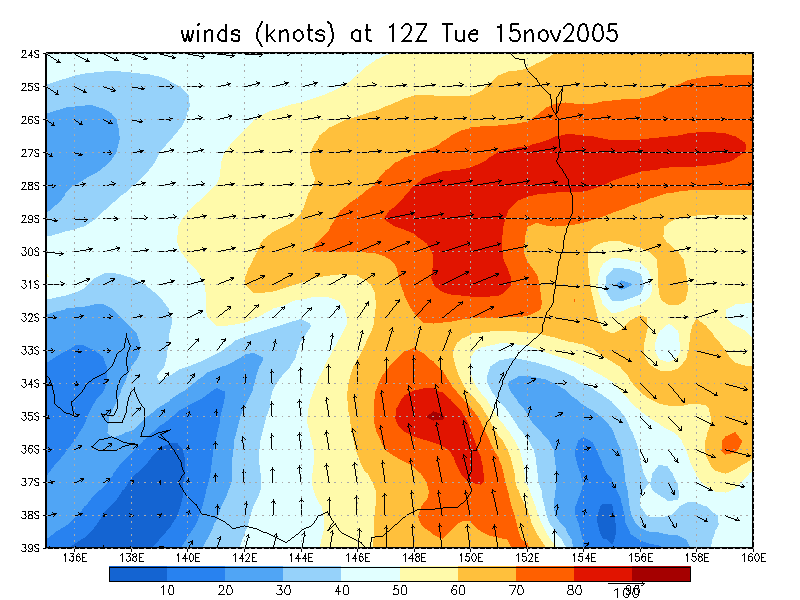
From NOAA 15/11/2005 06z analysis
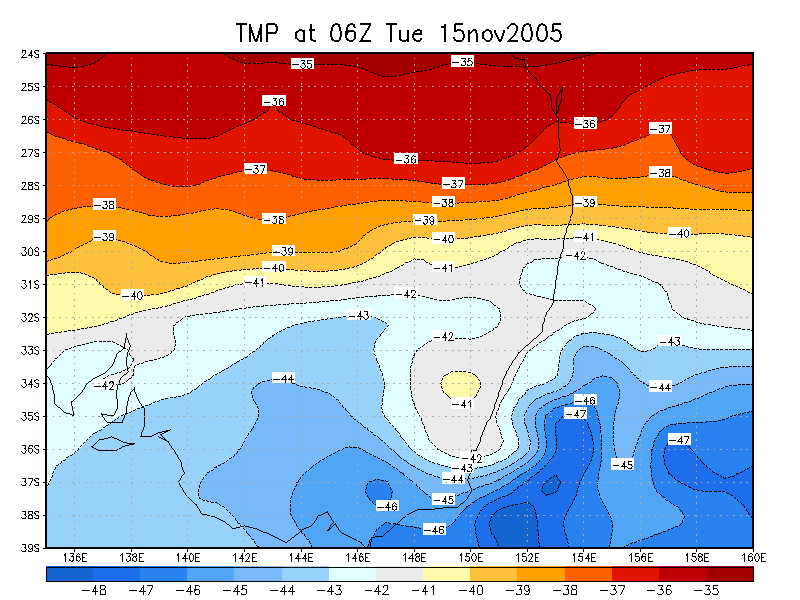
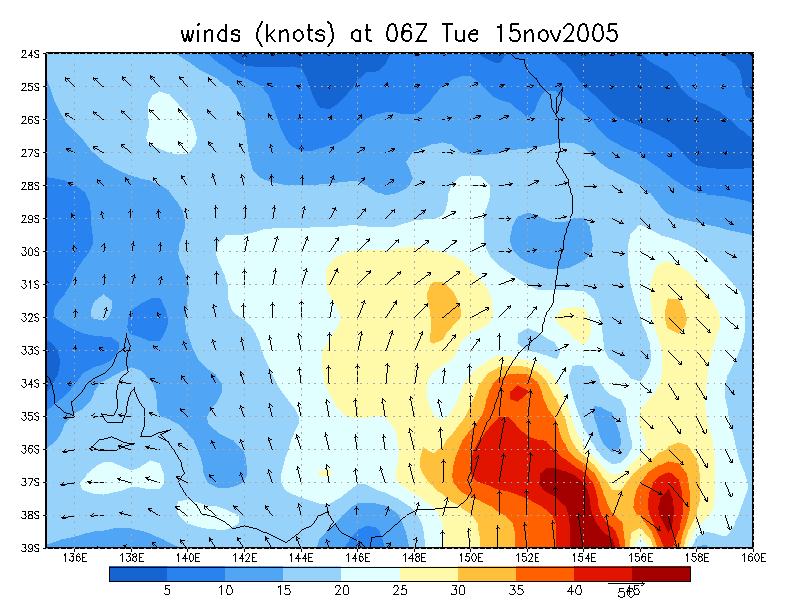
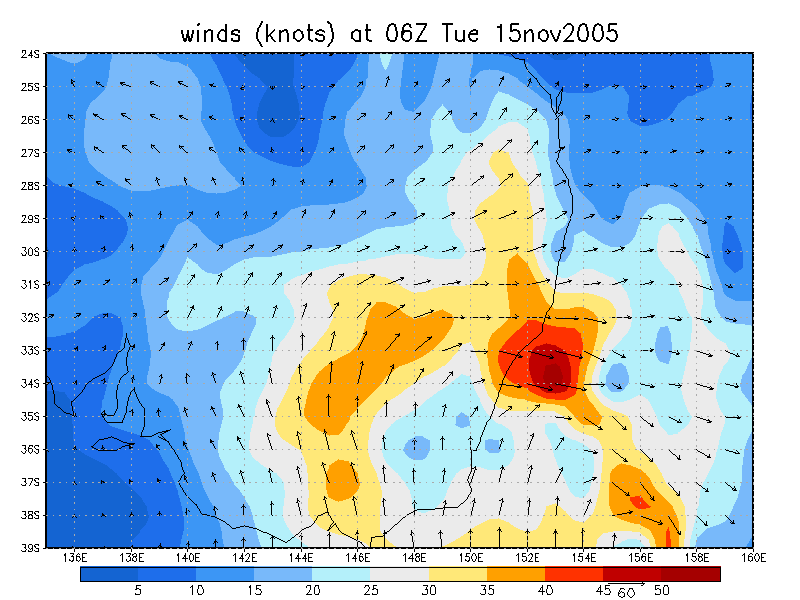
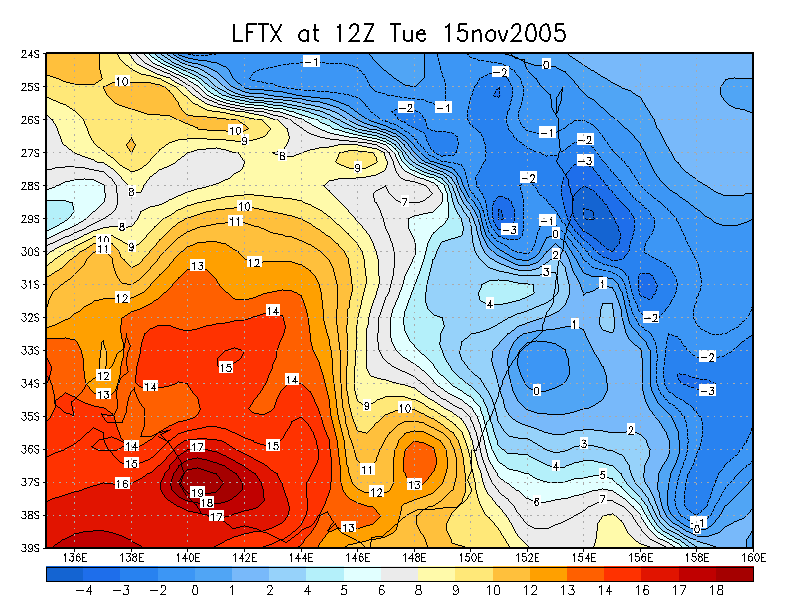
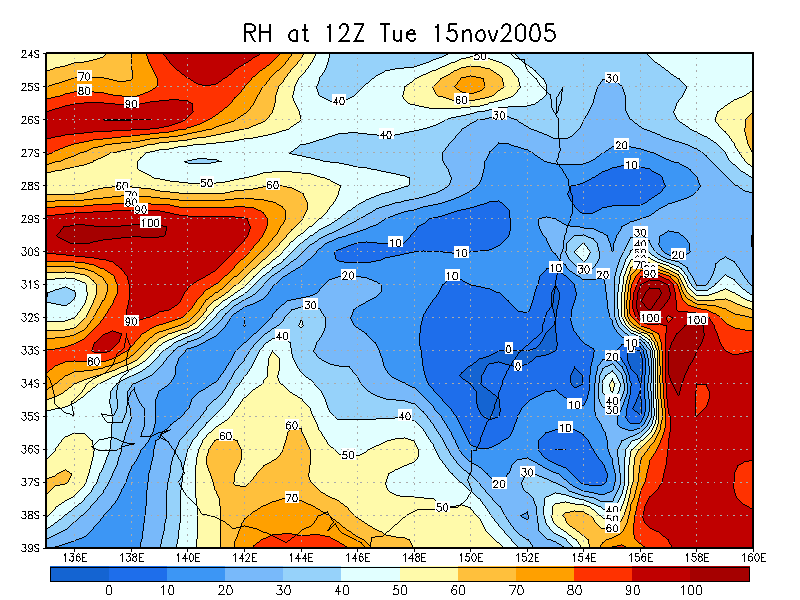
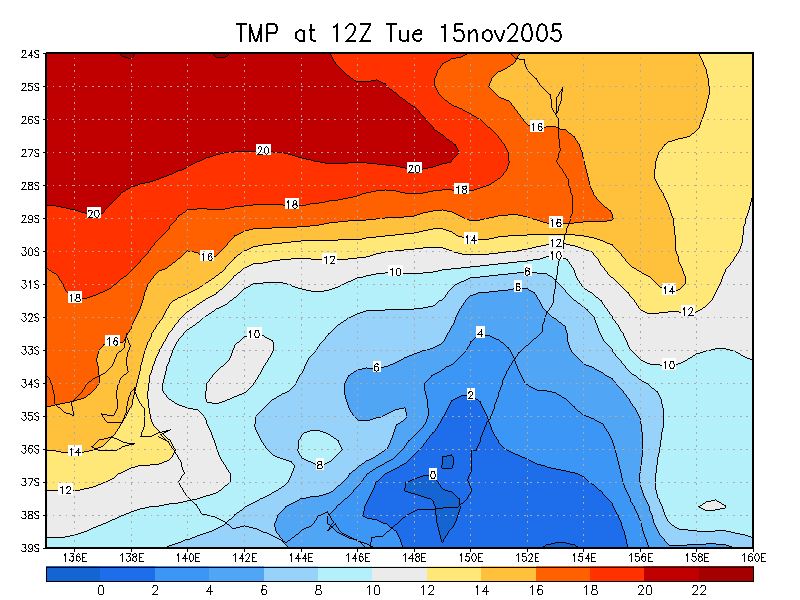
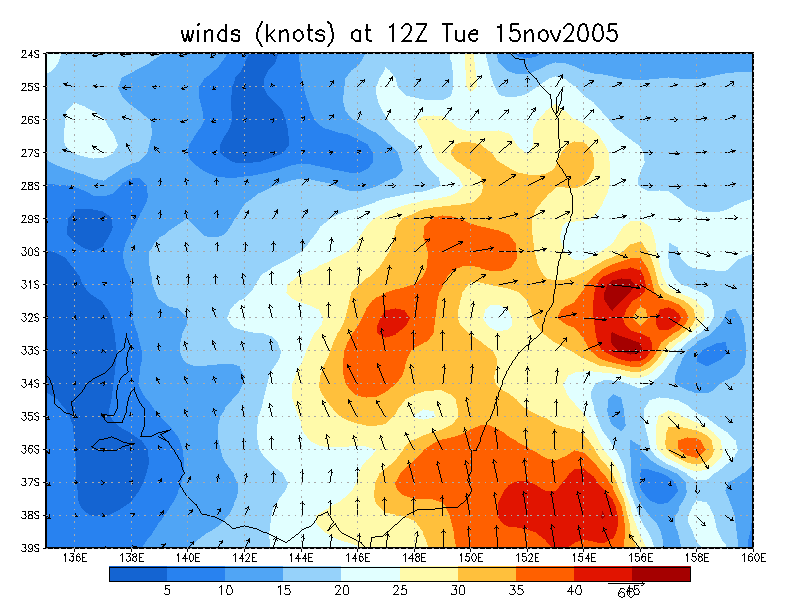
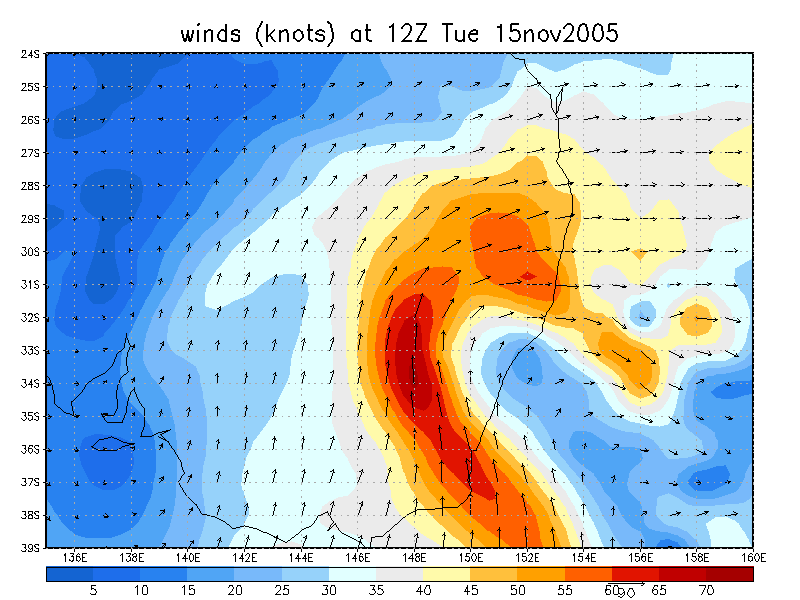
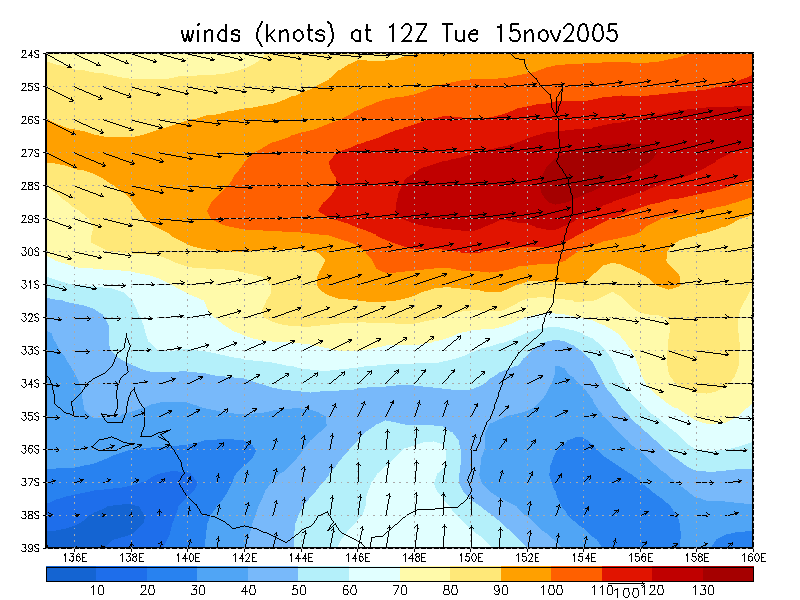
From NOAA 15/11/2005 12z analysis
|
Document: 200511-04.htm Updated: 13th January 2006 |
[Australian Severe Weather index] [Copyright Notice] [Email Contacts] [Search This Site] |