and Chasing
[Index][Archives]
Storm Chase and East Coast Low: Sunday 24th to Monday 25th September 1995
by Michael Bath and Jimmy Deguara
| Storm News and Chasing [Index][Archives] |
Storm Chase and East Coast Low: Sunday 24th to Monday 25th September 1995 by Michael Bath and Jimmy Deguara |
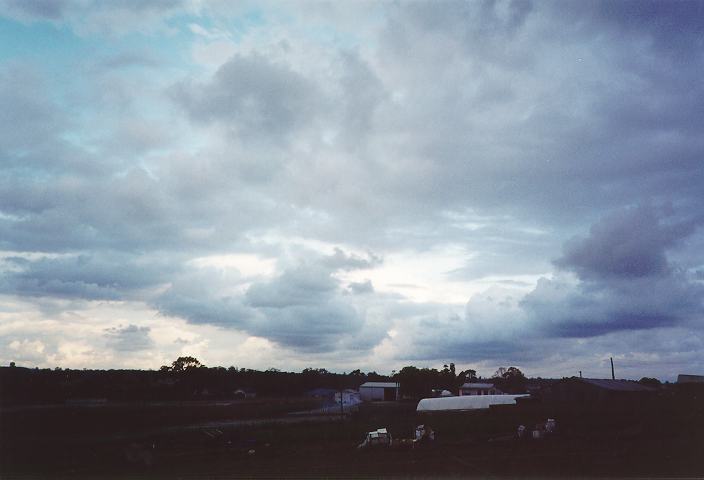
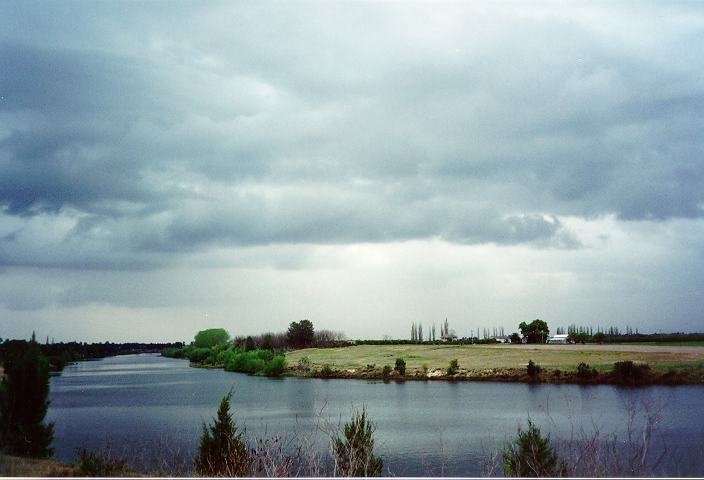
Developing clouds during the afternoon of 24th September. Photographs by Jimmy Deguara.
Heavy rain was occurring in some areas from around 5pm with thunder and lightning increasing as it approached the Metropolitan area. We traveled through the area for a while longer, but it was getting too dark and wet to photograph anything else so we headed back.
At around 8pm at Oakhurst a storm cell dumped about 20mm in 10 minutes. Hail and 61mm of rain in 35 minutes was reported in the Wentworthville area from a more intense localized storm. The storms moved in a south-easterly direction. Moderate rain continued through the night with 89mm in my gauge by 9am on the 25th.
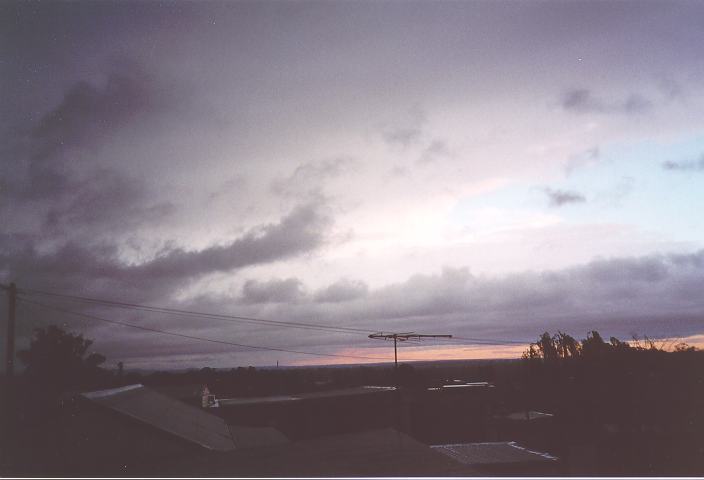
The low pressure centre intensified off the coast during the night bringing gale force winds and some heavy falls of rain. During the early morning period (dawn), the sky to the north of the Sydney area was totally free of cloud indicating that the main cloud mass had cleared the coast in that region. However, in the region extending from the south-east to the west and north-west, a cloud band was approaching moving east and slowly enveloping the Sydney region. The stratus clouds were moving ahead of the cloud mass mainly in the region where rain had begun falling. An important clue to indicate that the low was to the east or to the north-east and strengthening was the increasing strength of the southerly winds. It would be interesting to see what the winds were in the Northern Suburbs region at this time at various heights of the atmosphere.
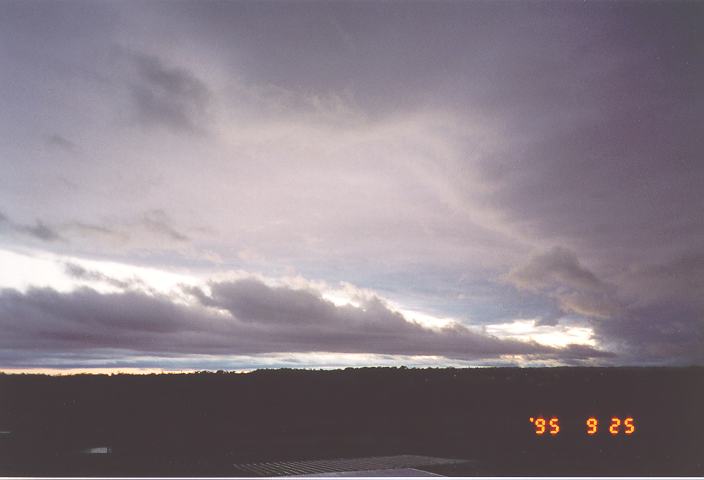
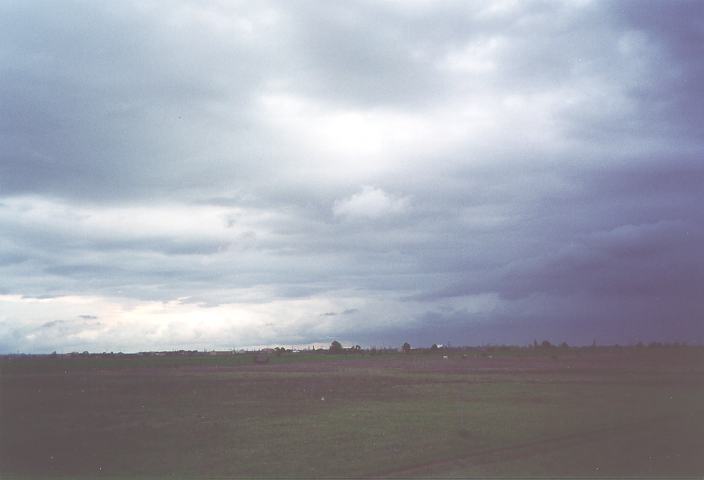
The main cloud band is moving overhead to the northeast with stratus from the south.
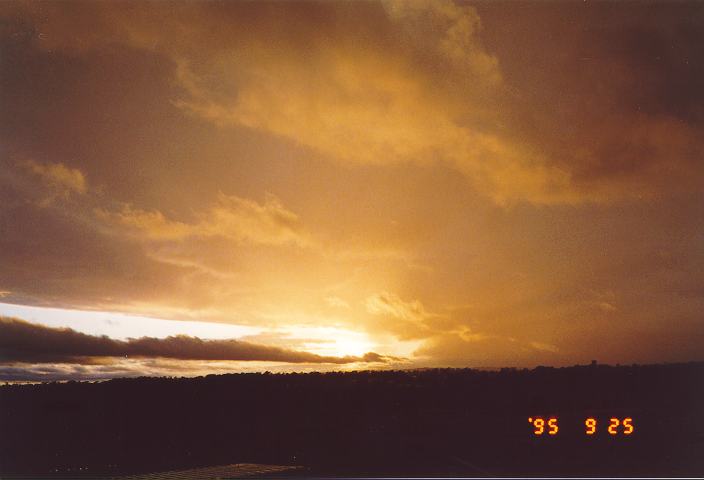
Our observations indicate that this approaching cloud band was the back end of the hook circulation of the low. It dumped most of the heavy rain over the western suburbs up to mid-morning. At this stage, brief sunshine occurred allowing the middle level cloud to be observed briefly. It indicates that this band was moving towards the coast. But the southerly airstream persisted dumping more rain to heavy rain but easing and becoming less frequent later.
Gale force winds and torrential rain damaged houses and flooded roads in many areas. Blackouts to about 44,000 homes were caused by the winds which were gusting to over 100km/h. A 40 square metre section of roof was ripped off Central Station.
During the event the State Emergency Service (SES) were called out about 2100 times.
A $10 million damage bill is expected from the storm.
Warragamba's 9000 square kilometre catchment received up to 156mm of rain which boosted the dam level by 10% to about 75% of capacity.
Click here to view the rainfall isohyet map of Sydney for the 48 hours to 9am 26th September 1995
Rainfall Readings for Sydney and Surrounding Areas for the 24 hours to 9am on the 25th and 26th of September 1995
| Suburb/Town | 25th Sep | 26th Sep |
|---|---|---|
| Avalon | 38 | 51 |
| Bankstown | 103 | 24 |
| Belrose | 48 | 68 |
| Bexley | 145 | 54 |
| Cronulla | 156 | 64 |
| Epping | 73 | 48 |
| Frenchs Forest | 43 | 82 |
| Gordon | 65 | 58 |
| Lucas Heights | 148 | 45 |
| Mosman | 49 | 75 |
| Newport | 32 | 58 |
| Oatley | 128 | 48 |
| Parramatta | 110 | 29 |
| Randwick | 69 | 68 |
| Riverview | 87 | n/a |
| Sydney | 74 | 71 |
| Sydney Airport | 115 | 65 |
| Turramurra | 74 | 57 |
| Berowra | 46 | 63 |
| Glenorie | 43 | 46 |
| Liverpool | 104 | 22 |
| Merrylands | 112 | 36 |
| Oakhurst | 89 | 27 |
| Penrith | 85 | n/a |
| Richmond | 76 | 31 |
| Seven Hills | 112 | 29 |
| Gosford | n/a | 78/2 |
| Wyong | 32 | 68 |
| Peats Ridge | 36 | 52 |
| Nobbys Head | 12 | 38 |
| Norah Head | 34 | 50 |
| Mangrove Mt. | 41 | 56 |
| Berry | 140 | 51 |
| Bowral | 128 | 41 |
| Darkes Forest | 132 | 68 |
| Greenwell Point | 98 | 22 |
| Kiama | 98 | 37 |
| Minto | 115 | n/a |
| Moss Vale | 115 | 46 |
| Nowra | 122 | 30 |
| Robertson | 186 | 94 |
| Wollongong | 95 | 42 |
| Bodalla | 91 | 0 |
| Candelo | 202 | 0 |
| Blackheath | 88 | 32 |
| Katoomba | 104 | 26 |
| Kurrajong Hts | 120 | 10 |
| Lithgow | 46 | 15 |
| Mt. Boyce | 69 | 25 |
| Oberon | 77 | 3 |
| Springwood | 83 | 7 |
Synoptic Charts provided by the Bureau of Meteorology
|
Document: 9509-02.htm
Updated: 5th April, 2004 |
[Australian Severe Weather index] [Copyright Notice] [Email Contacts] [Search This Site] |