and Chasing
[Index][Archives]
Explosive supercell produces Gorilla Hail: Sunday 26th October 2003
by Jimmy Deguara
| Storm News and Chasing [Index][Archives] |
Explosive supercell produces Gorilla Hail: Sunday 26th October 2003 by Jimmy Deguara |
I must say that since I have started chasing, October 2003 has been the most active October. It has produced some strong outbreaks with tornadic potential. Widespread severe storms have been reported mostly across New South Wales and southern Queensland during October. This event was no exception.
 After an excellent chase the previous day in my local region, plans were always to chase the North Coast as the setup was quite ideal. An upper trough was expected to pass over the region allowing for destabilisation during the afternoon period. A combination of high CAPE (Convective Available Potential Energy) approximately 3000 according to model predictions (Surface Lifted Index of -8) and strong deep layer shear made for a volatile environment easily supportive of explosive supercells. The expected wind shear profile would place a strong 50knot northwesterly upper level jet over the region of northeast New South Wales and southeast Queensland. Predictions of hail to cricket ball size was not out of the question in such an environment. Only one problem, we had to get there early - 5am start! I must admit David Croan did well to wake up and be ready to be picked up.
The day was expected to be a long one since we wanted to be at work the next day. The 7 hour trip up the coast was always going to be exciting - a transition from altocumulus castellanus in the Sydney region to a rain band to a severe thunderstorm during the late morning near Nambucca Heads. Passing through smaller hailstones, we allowed this storm to pass out to sea. There was some hail cover in some of the areas so we had just missed the hail deluge. Hailstones here seemed to measure up to about 3 or 4cm in diameter. Oh and the close lightning bolt in the field - WOW!
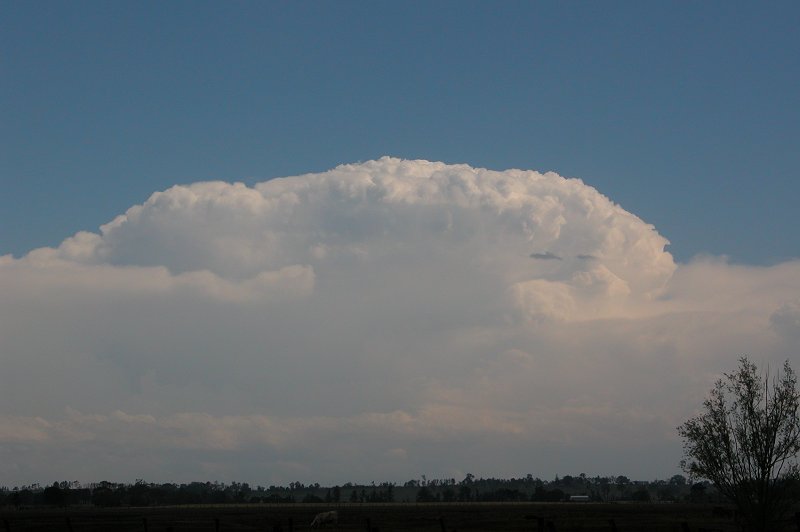
Stopping for lunch by midday at Coffs Harbour allowed for the change to develop. Well stratocumulus and south-easterly winds was not what we bargained for. So we wasted little time in heading further north as we had planned. Just out of Woolgoolga, the situation began to change somewhat. Warmer and more humid air - dewpoints on the increase. Brighter skies on the horizon. Northeasterlies. We were entering higher CAPE more unstable air. "Look at the updraft David?" Explosive but heading out over the ocean! Certainly impressive.
At Grafton it was time to re-fuel and prepare for the chase. The afternoon that lay ahead of us in terms of severe weather potential was a long one. There was some development in regions to the north of Grafton but this looked disorganised. We placed ourselves nearby and watched our favoured area to our west. Favoured area? When we stopped just north of town, the activity to the southwest and west looked ordinary. 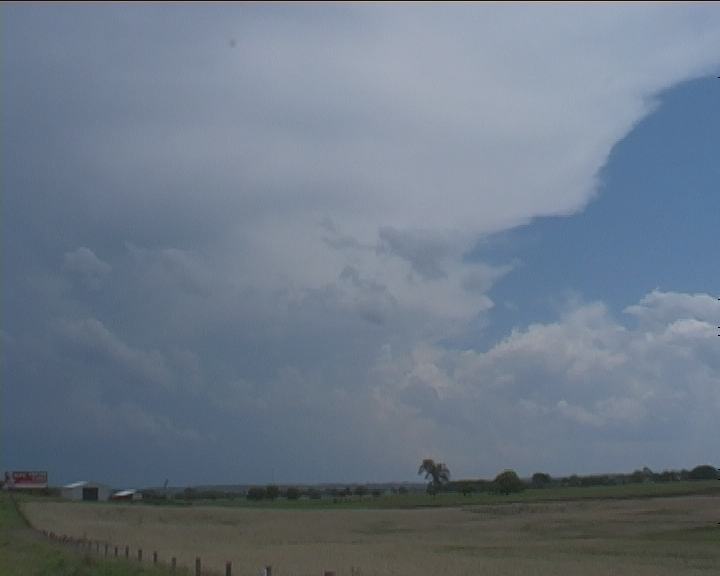 It lacked the hard crisp updrafts and powerful side anvils representative of this environment. The air was oppressive so what direction was the wind? Westerly? I was confused. Then it dawned on me - we were in the dryline.
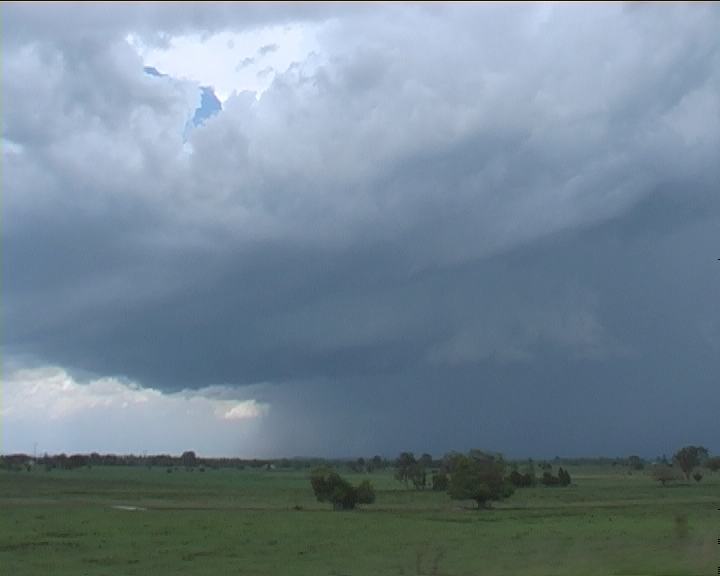
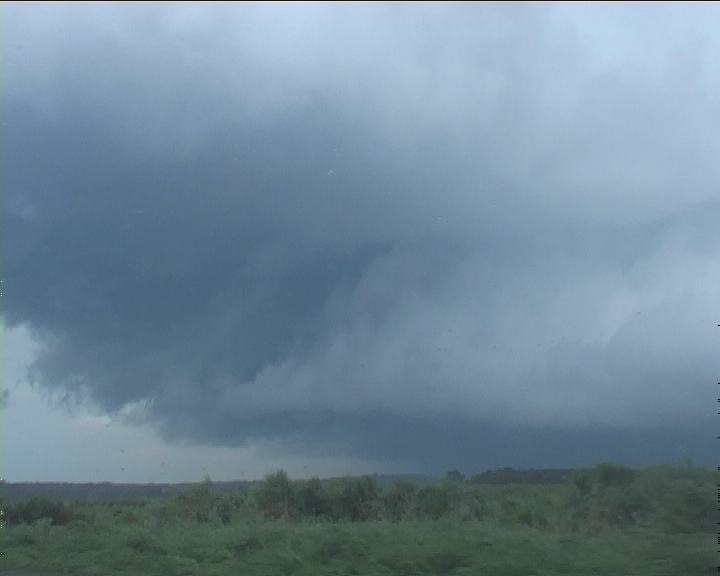
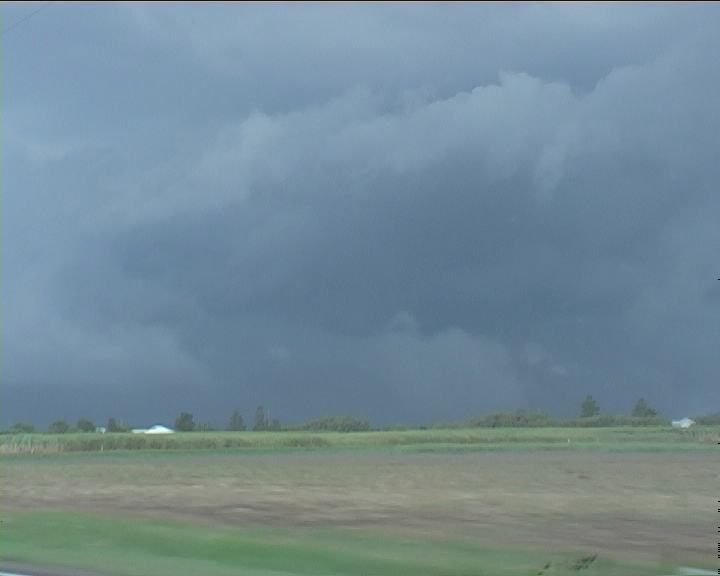
 The activity to the north at this point began to grow larger. A backshear developed. What took place from here on would be history was beyond comprehension! The storms to our north and northeast had begun to explode at a rapid pace like very few storms in the past. Not only were they explosive though, it was the rapid organisation of the base structure. A southern flank had developed and the rain free base was gradually moving toward us. Lightning activity to our northeast increased dramatically. Time to move.
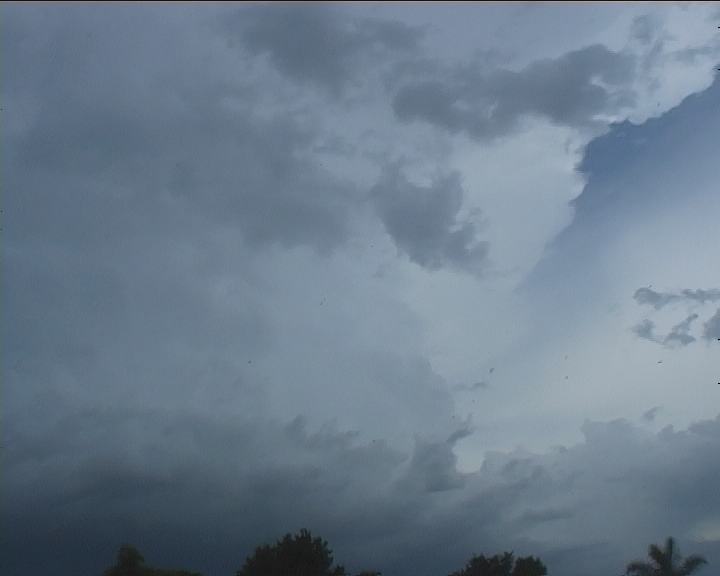
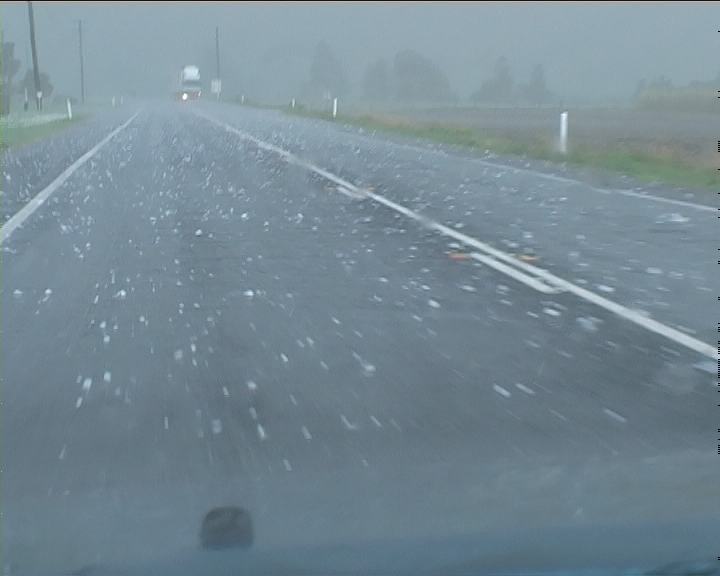
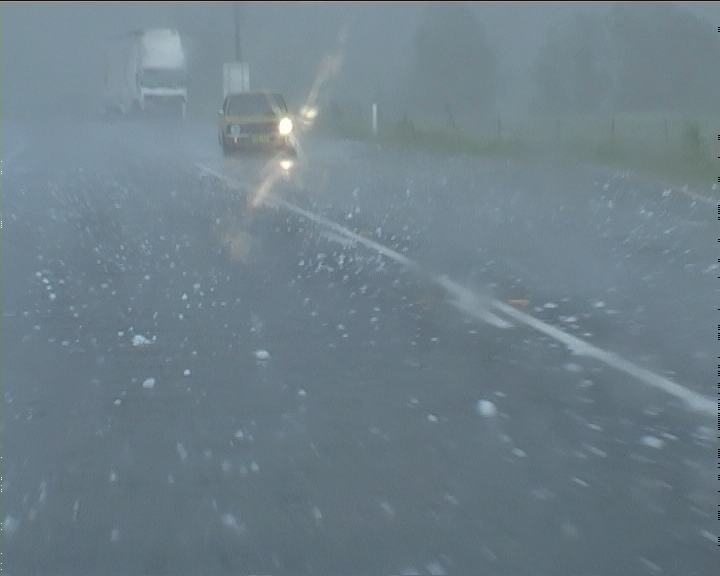
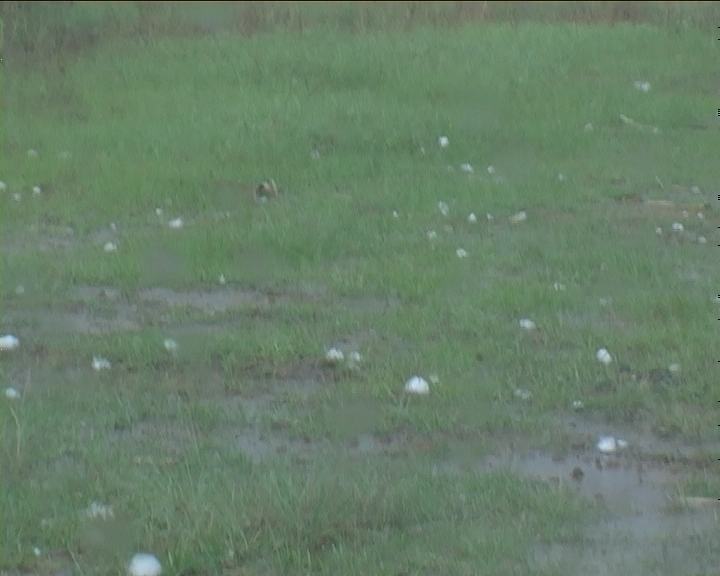
No sooner had I hung up did we realise that we were entering larger hail territory. Stripped leaves and hail on the road. How big were they? David suggested we stop and measure as he had noted a few larger stones. Further though, the odd splatter and a denser cover of predominant massive hail chunks all over the road and in the field. I felt a thump at my feet - a hailstone had bounced and thumped under the car beneath the pedals causing vibrations. We passed over a tributary of the Maclean River and saw impressive splashing of hailstones. David began pointing out more 8 - 9cm hailstones. Finally, we parked on the side next to a paddock. David wanted to lean out and pick up a stone. "You have got to be kidding" I said. "Be careful"�.. Booom - one almighty thump!! Now that was a reminder if anything could convince David. Another addition to the collection of 'craters' on my vehicle. Being sporadic hail it meant David could still quickly lean forward and grab a hailstone. The sporadic activity under a mostly rain free base meant only the largest stones were falling. The field and road were littered with giant hailstones. It was a scene I personally had never observed in Australia - more reminiscent of a scene in Tornado Alley. Headed for Yamba, we observed a spectacular lowered base structure and interesting features. And of course an inflow band to the east. Back at Tyndale, scattered giant hailstones littered the lawns to our left. We stopped for more measurements. David collected whilst I filmed and photographed. Amazing to note that even about 45 minutes after the event, there were still hailstones of this size only partially melted. "Look what you left near you?" David prompted as he picked up a giant!! The storms to the southwest developed rather quickly but were not impressive. We passed through very heavy rain and small hailstones. The chase was over - time to finally make our way to Sydney.
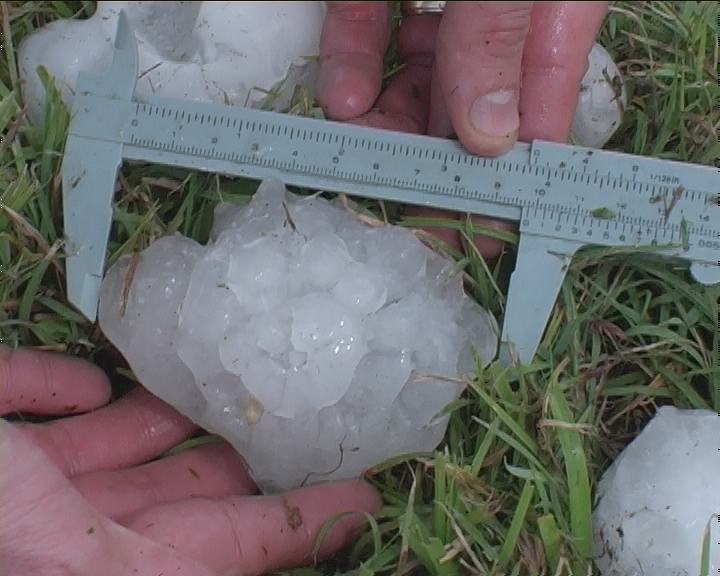
The trip back was one of reflection and a realisation of just how big these hailstones were: the 9.6cm being larger than the hailstone officially measured during the 14th April 1999 hailstorm. It was a short but intense chase and one well worth it.
Click here for all stills listed online of this event.
Report showing pictures viewed from the north If you (or someone you know) have any photographs or video of this event or any other type of severe storm such as damage, the storm structure itself or hail, please feel free to contact Jimmy Deguara. Your contributions are very welcome. Please any photographs or video footage are important so don't discount anything.
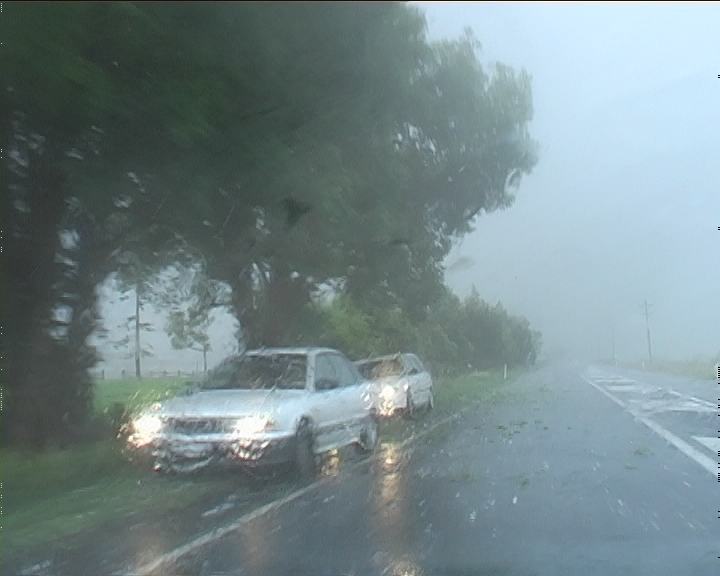 Core-punching is not for the faint-hearted and in this type of environment can be dangerous (flying shattered glass and damage to panels of the vehicle). An understanding of the storm structure is critical in determining where the largest hail would be. The structure was impressive but the updrafts were powerful particularly to the east. It was an eerie feeling. We passed through the some heavy rain initially and then hail. Two or three centimetres at first and finally golf ball sized. I phoned this into the Bureau of Meteorology since I am a storm spotter for the severe weather alert system.
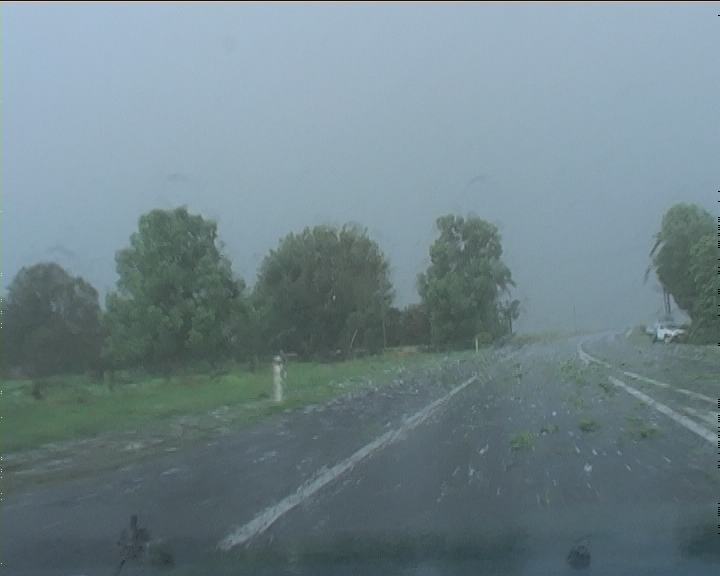


 Some more video and picture opportunities whilst David searched for more hailstones. The hail had stopped falling. Some quick measurements for recording purposes and we were off. The storm had made the split as anticipated and we wanted the left mover.
 But it was a lost cause - the storm had taken the usual path heading out over the ocean evading capture. Unfortunate! What do we do now? A phone call to Mario was simply to alert us how fast storms were moving and if we had time to intercept storms further north along the dryline. Getting back to Sydney was an option. More storms developing to the southwest and an opportunity to get back to the storm affected areas, we decided on southwest.
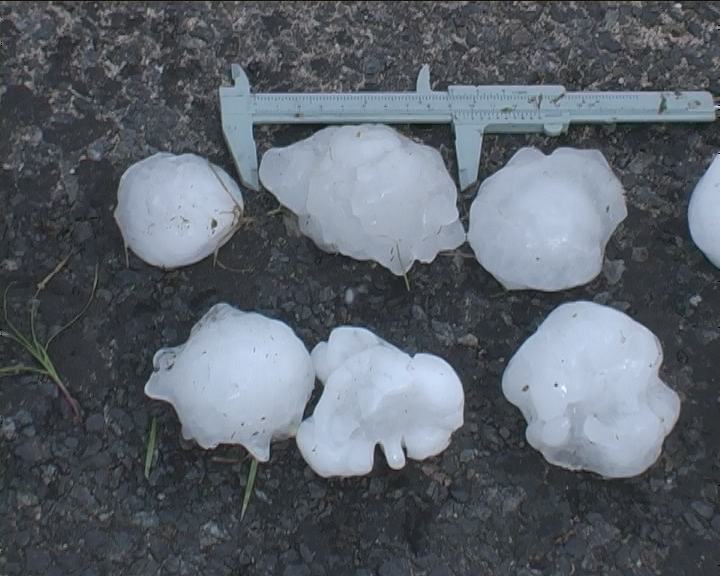
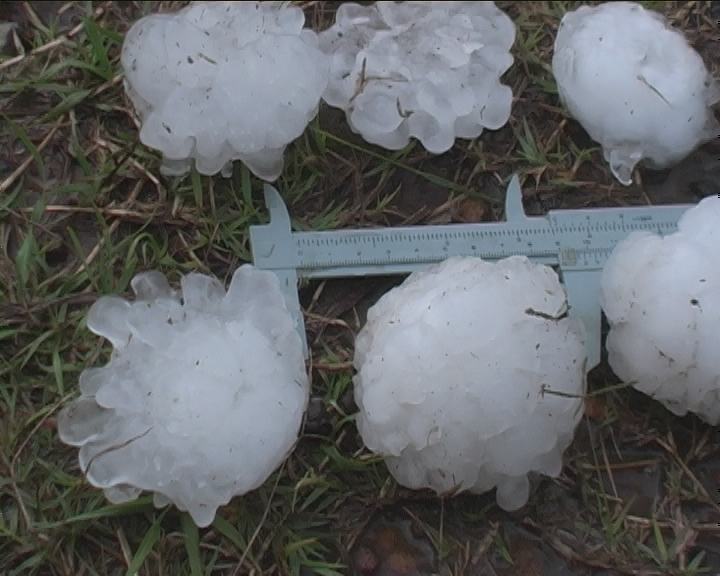
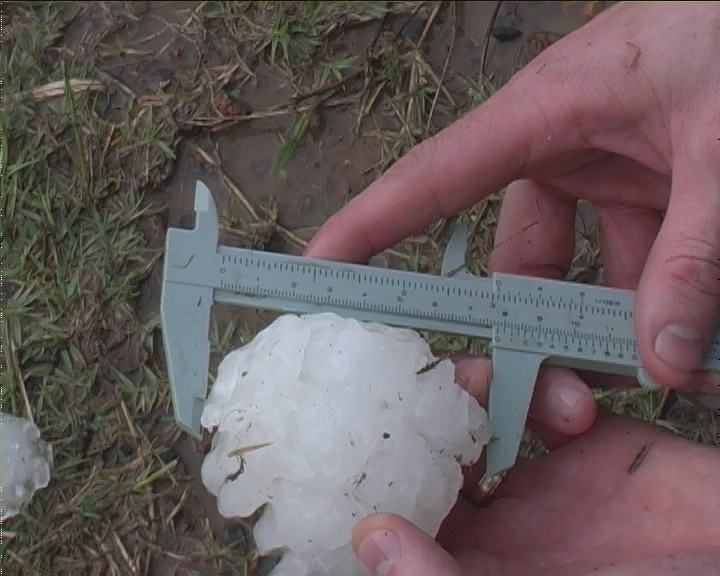
 I must admit I missed it but look at the size of it! A quick measure and David announced conservatively 9.6cm according to the callipers. This by far easily surpasses any hailstone size I have observed on any chase. And 45 minutes of melting had taken place. It was simply unbelievable.
 by Dave Ellem.
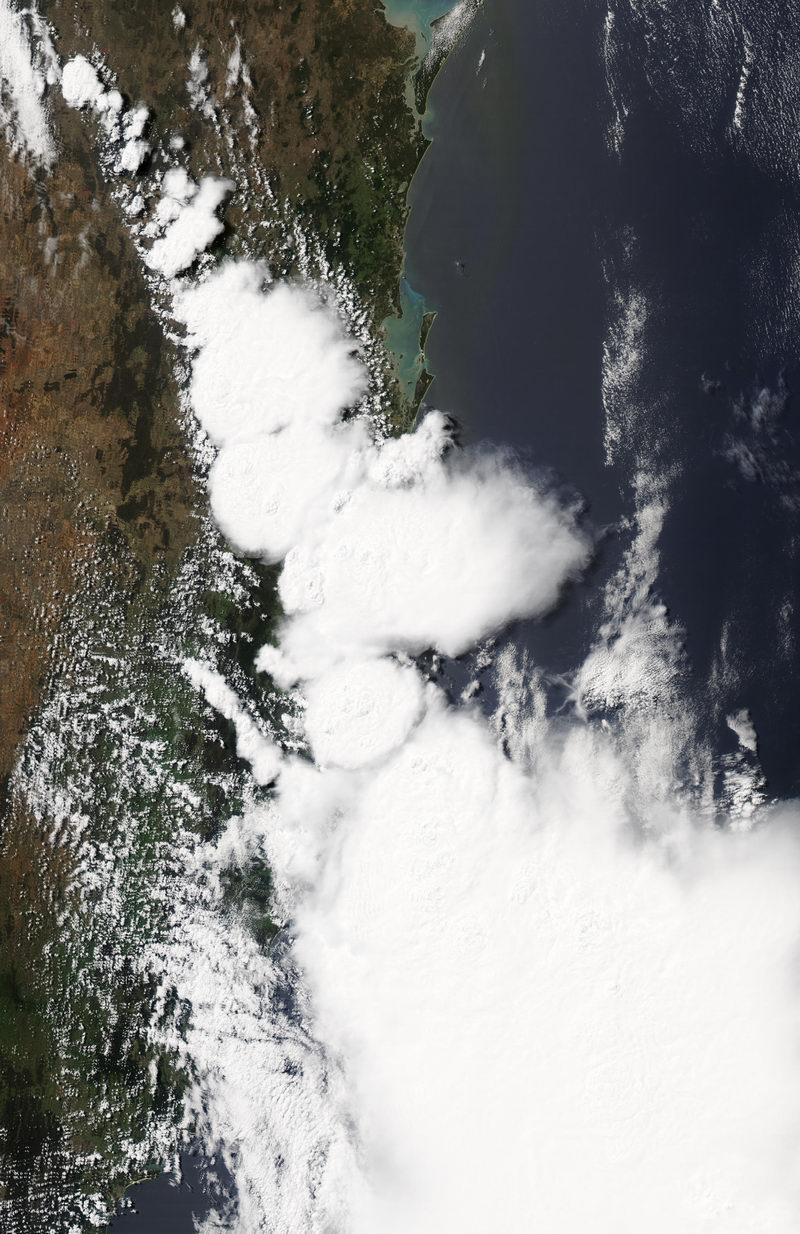
From Bureau of Meteorology.
From Bureau of Meteorology.
Images are at 06 to 10z (4pm to 8pm local)
22z to 10z animation
From Bureau of Meteorology.
From NOAA 26/10/2003 06z analysis run
Report compiled by Dave Ellem and Michael Bath
|
Document: 200310-08.htm
Updated: 2nd April, 2004 |
[Australian Severe Weather index] [Copyright Notice] [Email Contacts] [Search This Site] |