and Chasing
[Index][Archives]
Tropical Low with Gales and Flooding in Northeast NSW and Southeast Queensland: Friday 5th to Saturday 6th March 2004
by Michael Bath including photos by Dave Ellem
| Storm News and Chasing [Index][Archives] |
Tropical Low with Gales and Flooding in Northeast NSW and Southeast Queensland: Friday 5th to Saturday 6th March 2004 by Michael Bath including photos by Dave Ellem |
I had expected rain or scattered showers to have started on the NSW Far North Coast overnight Thursday 4th March, however it remained largely dry until midday Friday 5th. Moderate showers and rain patches set in from about 1pm. Winds were not particularly strong at this stage.
The most severe weather occurred from 6pm Friday, with winds peaking locally between 1am and 3am Saturday. Cape Byron measured a few gusts over 100km/h, though received a lot less rain than observing sites just inland from the coast.
We lost power at 2.15am and it was not restored until 2.30pm - over 12 hours which is very annoying when relying on electric pumps for water ! (I live out of town). Rainfall fell at a rate of about 20mm/hour for about 6 hours to 1am - then eased, with the 24 hour total of 152mm. The bulk of the rain fell in just 8 hours.
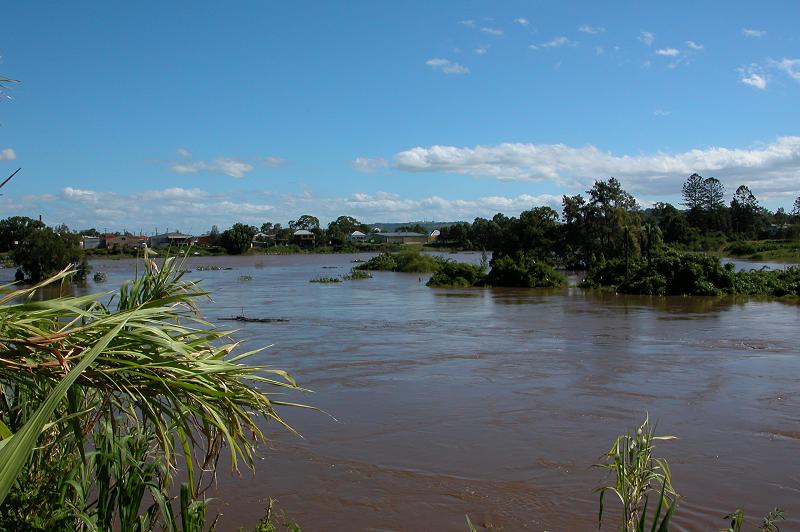
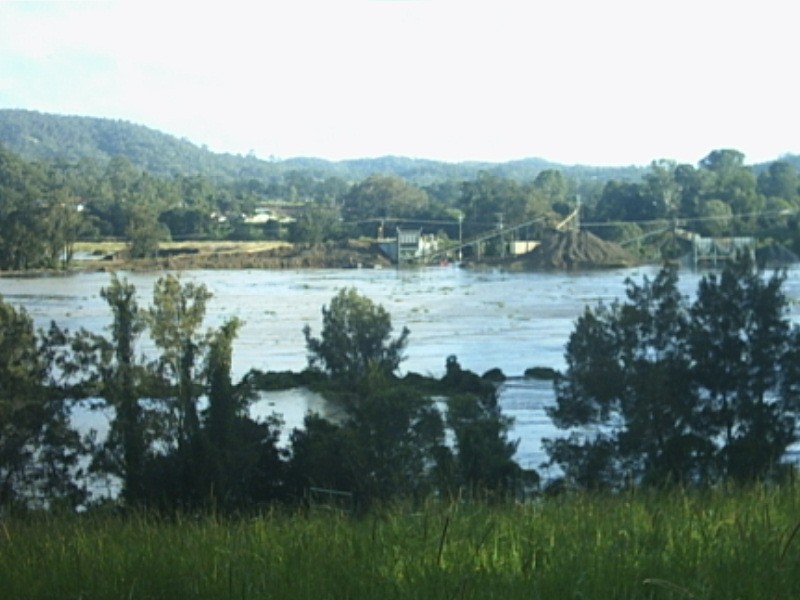
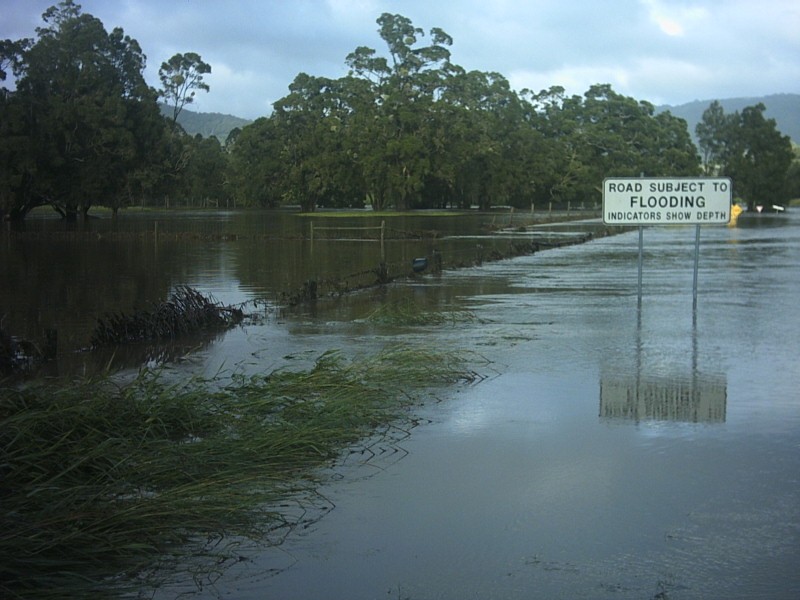
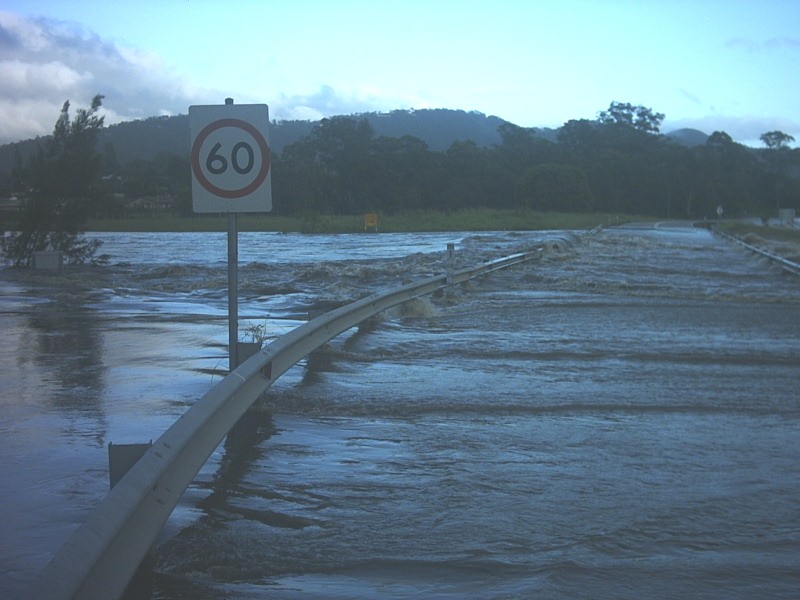
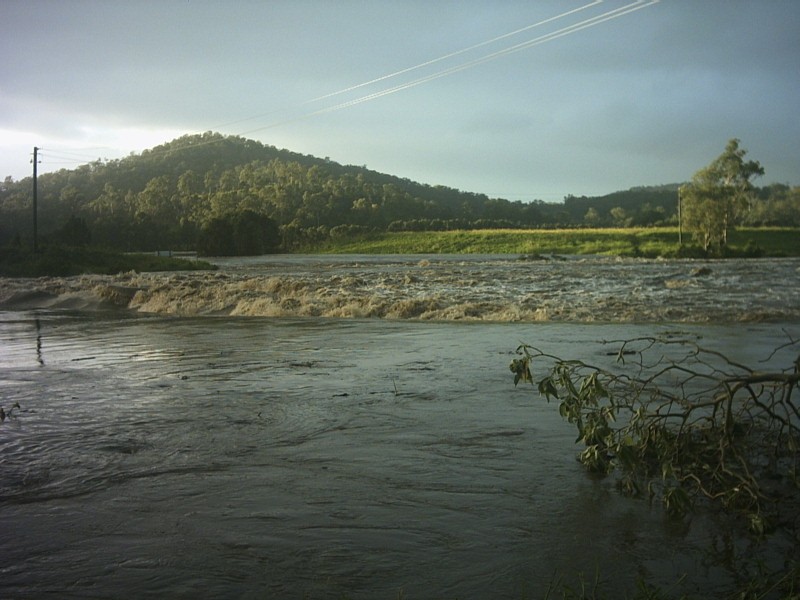
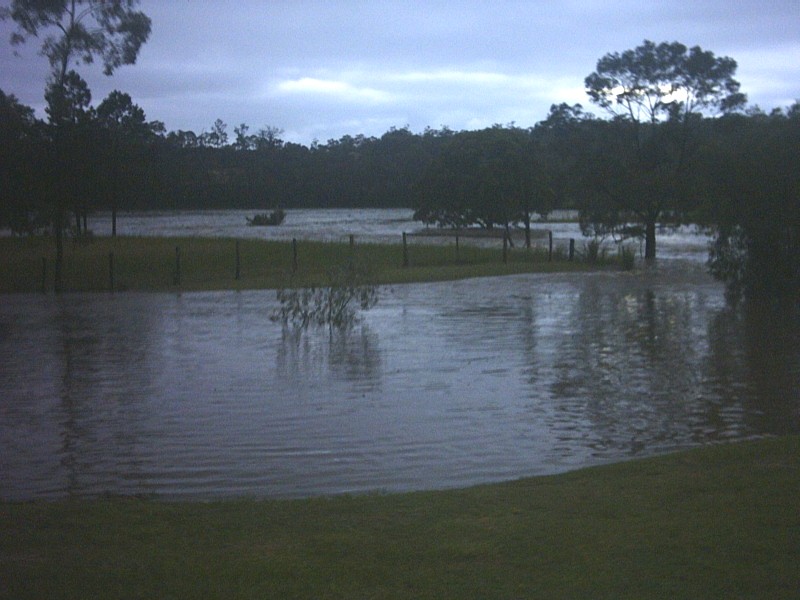
Around my area (20km SW of Cape Byron), some trees had been brought down with many large (30cm diameter) branches snapped off, and leaf and twig litter was everywhere. Quite a number of roads were cut by floodwaters, and the main rivers were rising quickly in Lismore itself with a river peak of 7.05 metres (AHD) occurring about 11.45pm Saturday night (this is a moderate level and only inundates lower parts of the city).
I estimate winds reached 90 to 100 km/h at my property late Friday night and early Saturday morning. Winds veered from SE to E then NE (as the rain cleared) during the event, with quite strong northerlies during Saturday with mainly fine conditions.
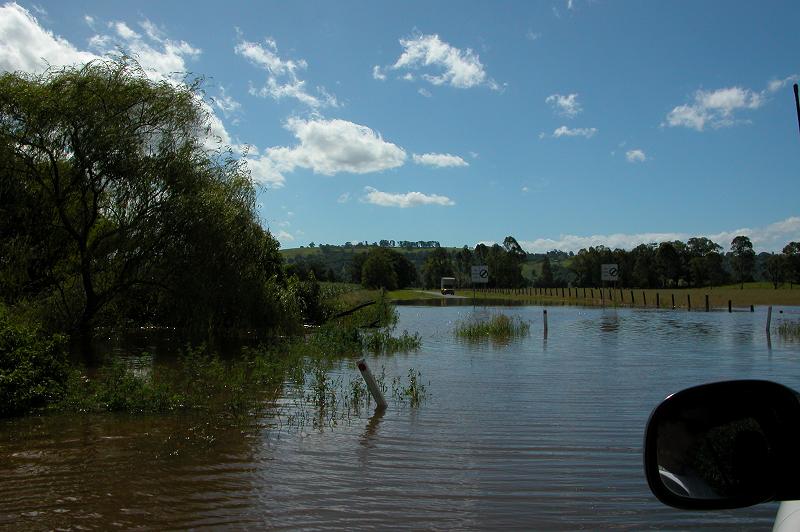
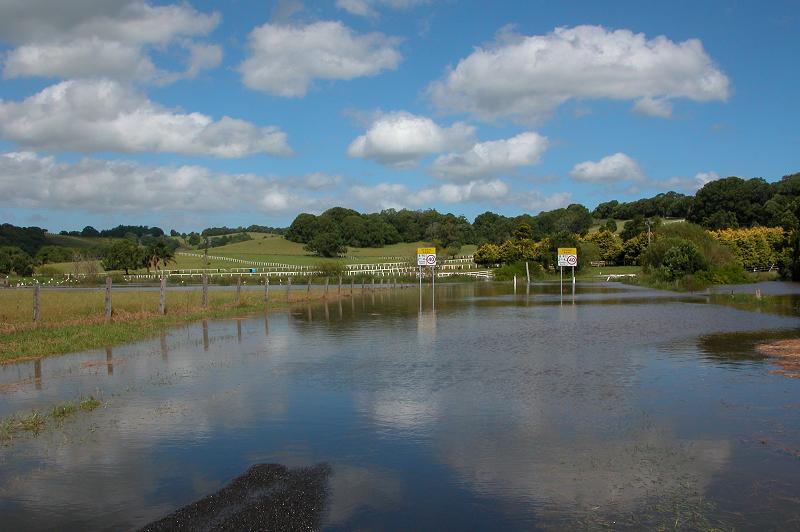
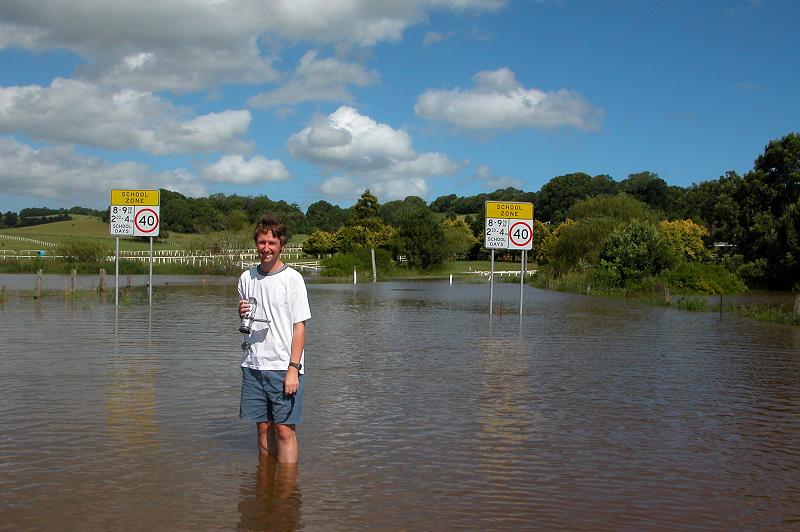
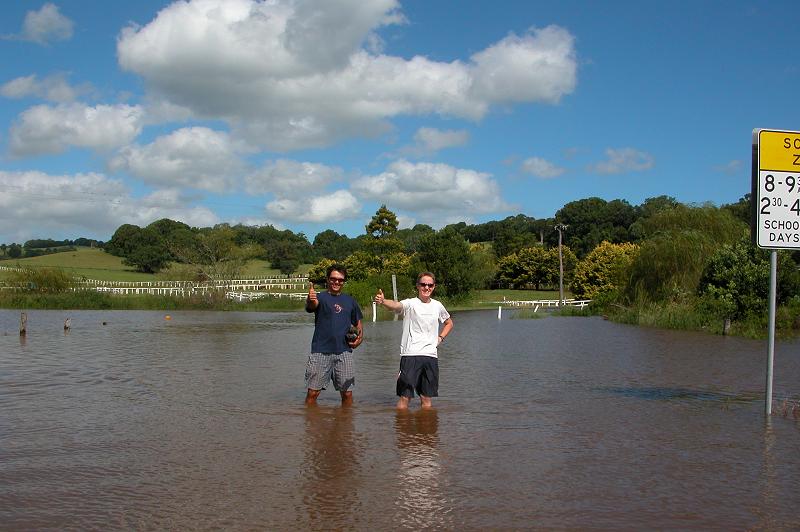
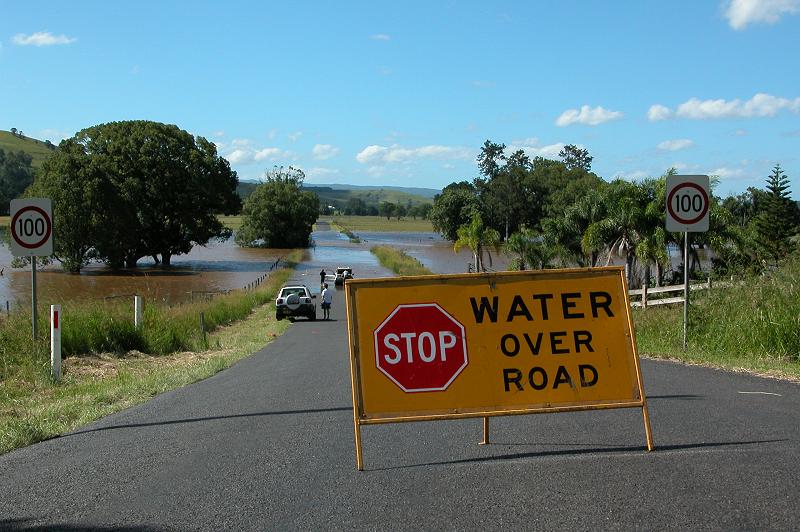
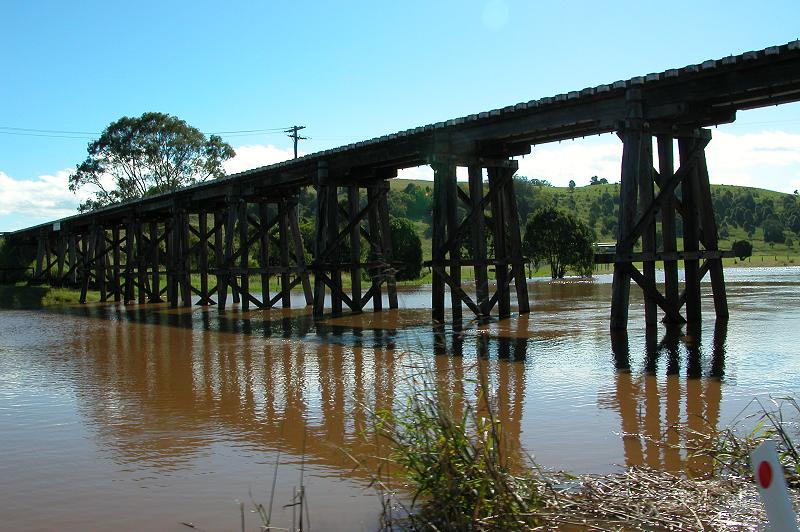
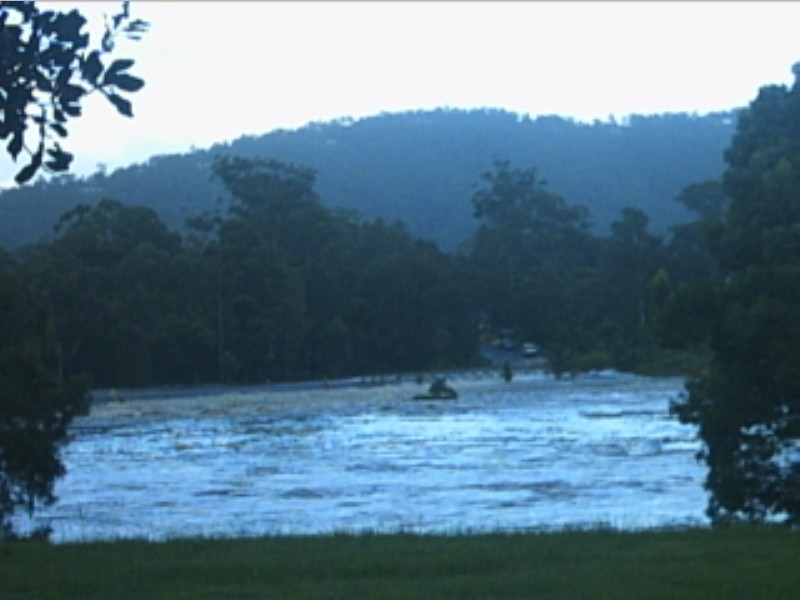
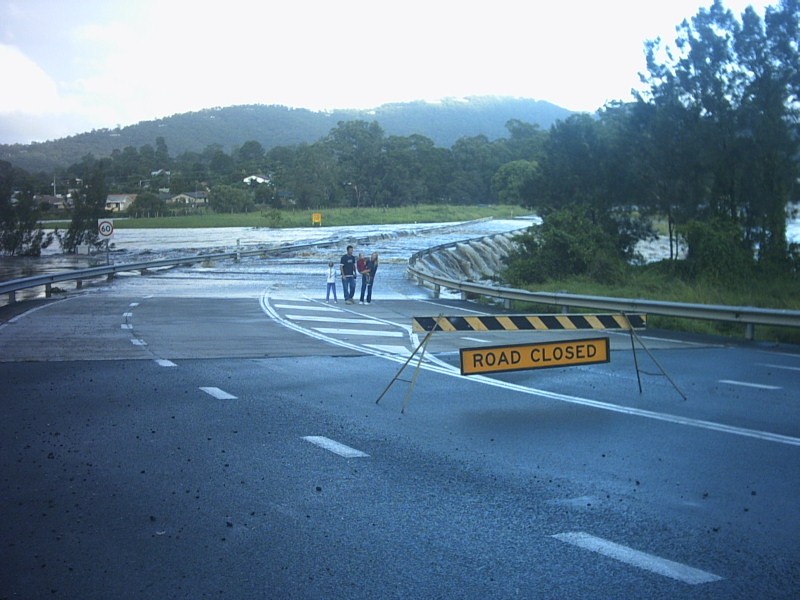
Saturday afternoon Dave Ellem, Rodney Wallbridge and I toured around the district to see the extent of flooding and any damage.
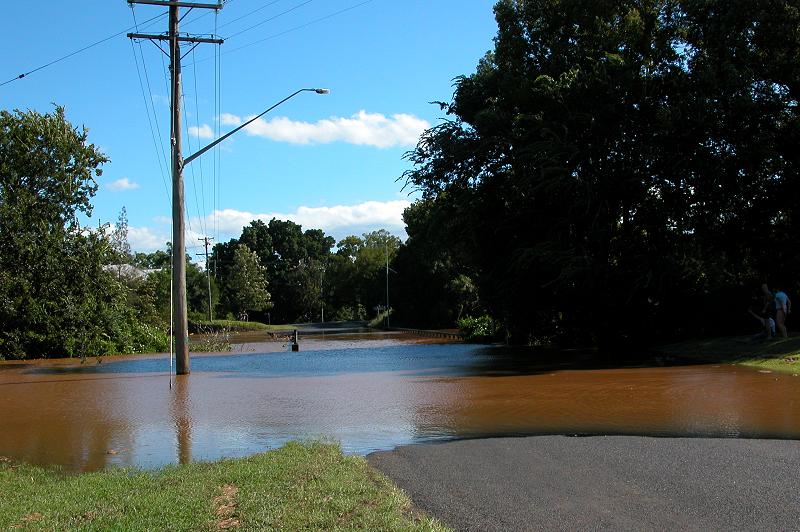
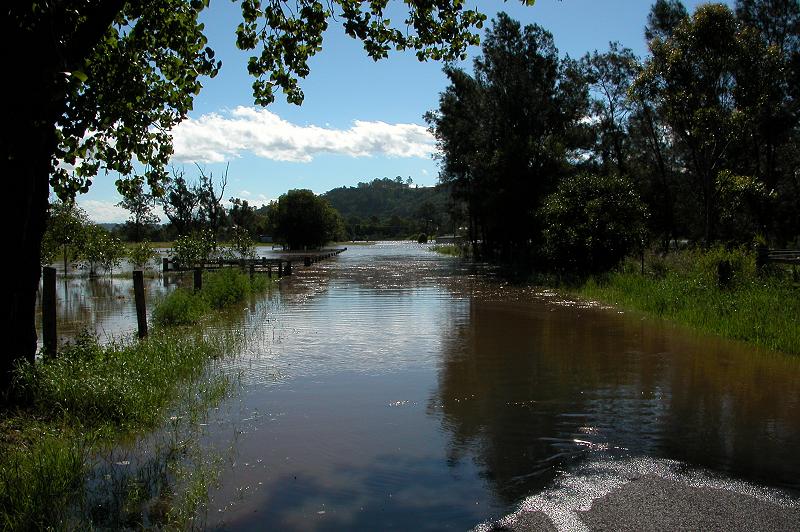
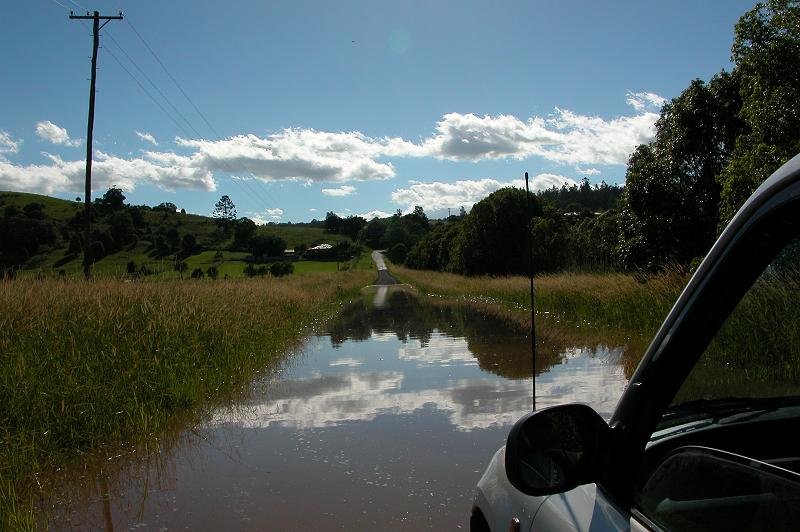
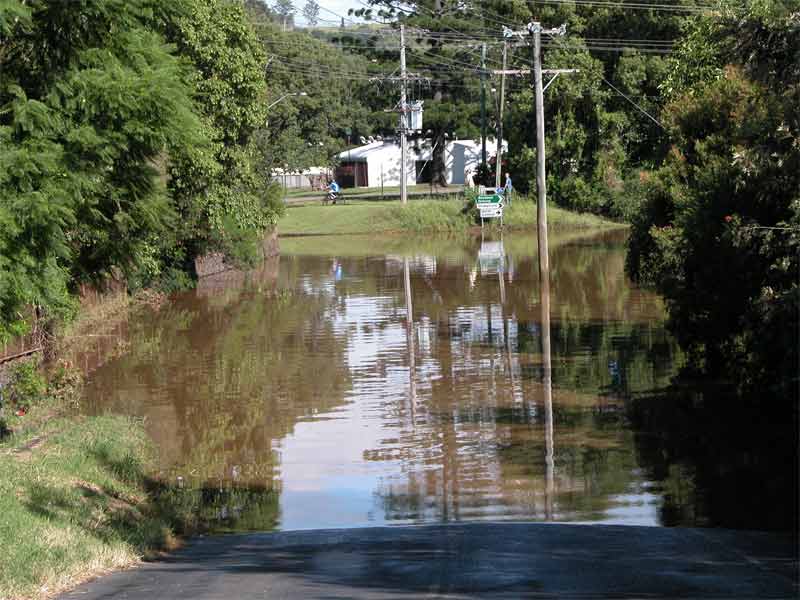
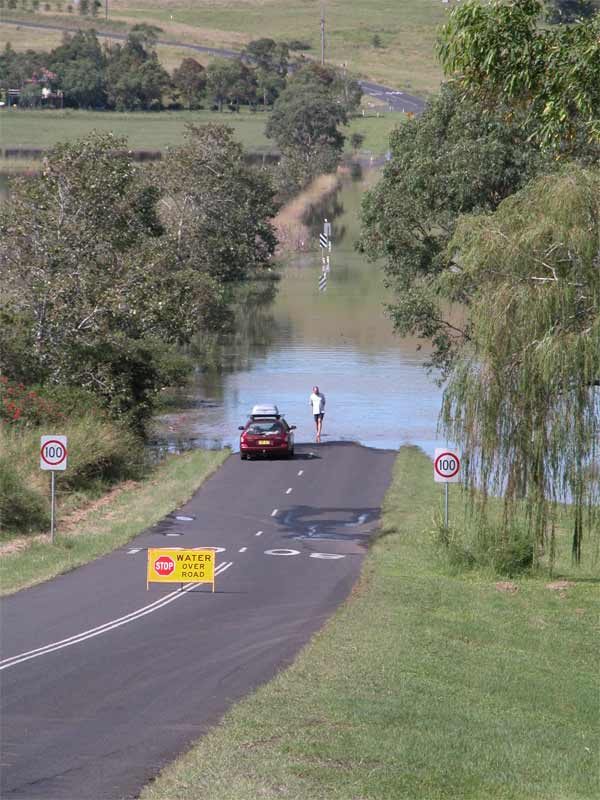
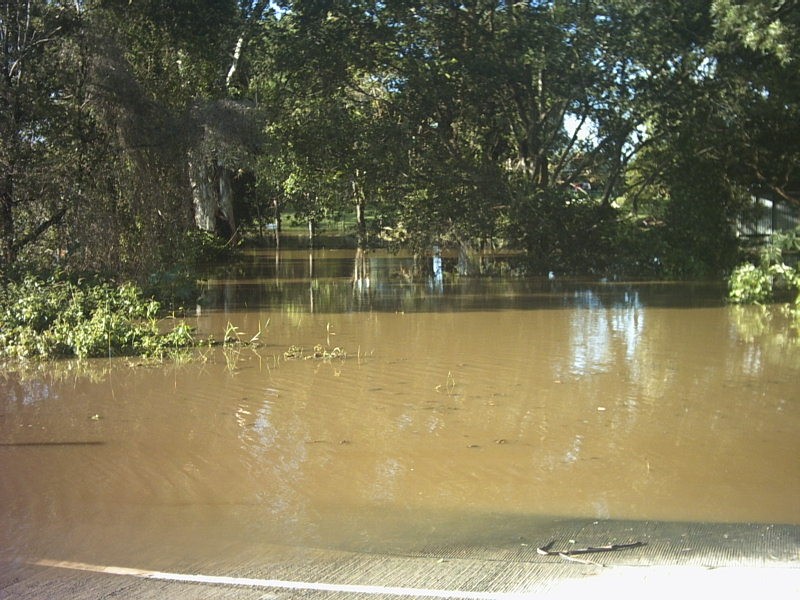
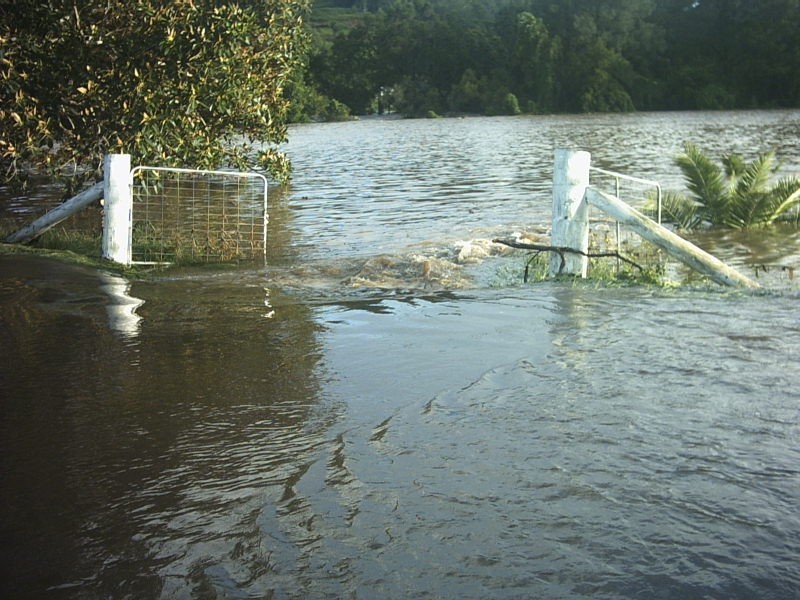
We headed down into the valley from McLeans Ridges to Eltham via Boatharbour Road. Just past the Eltham public school the single lane road dips into a causeway. The road was covered by slow moving water up to 50 cm deep. Rodney was aching to test the RAV4 out through some water so we went through. Unfortunately he should not have stopped, as there is no snorkel on the vehicle and it almost stalled with the exhaust under water ! Luckily it kept going, and then we took a few pics of the scene.
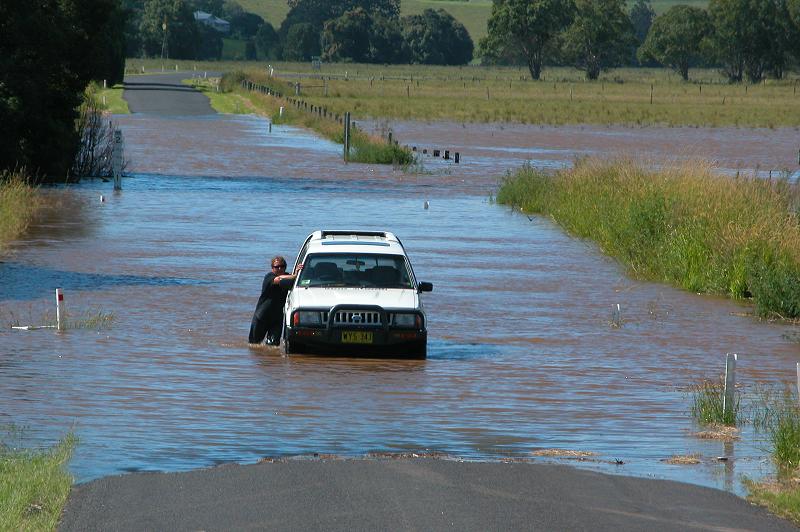
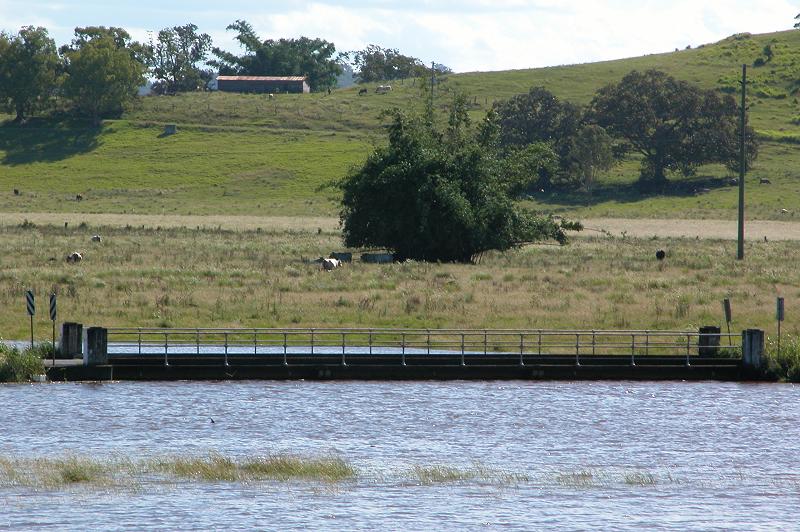
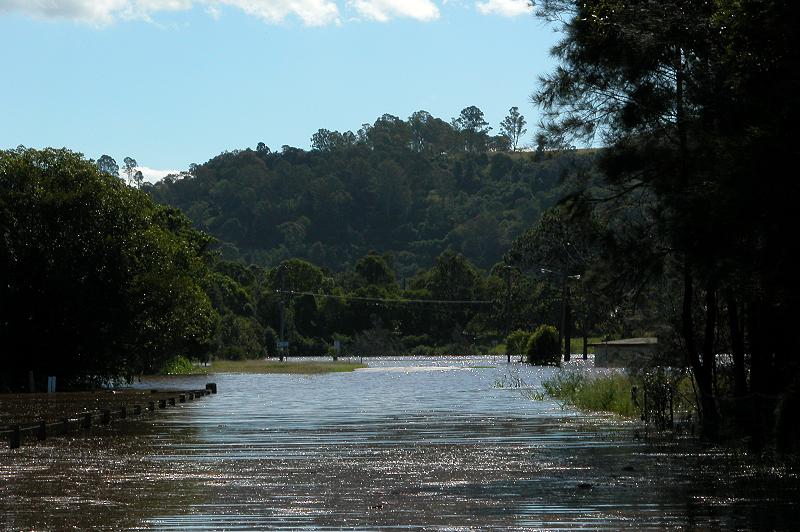
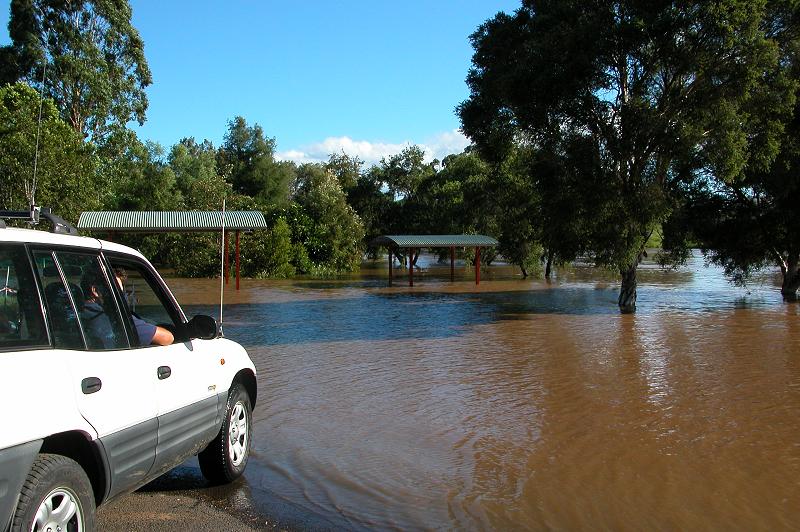
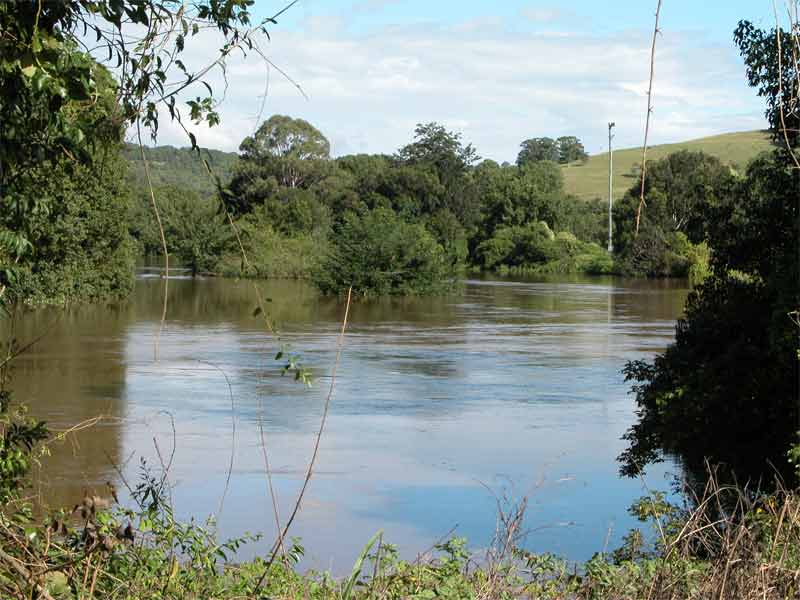
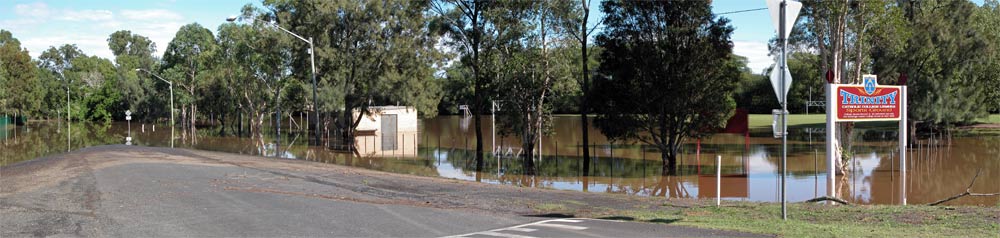
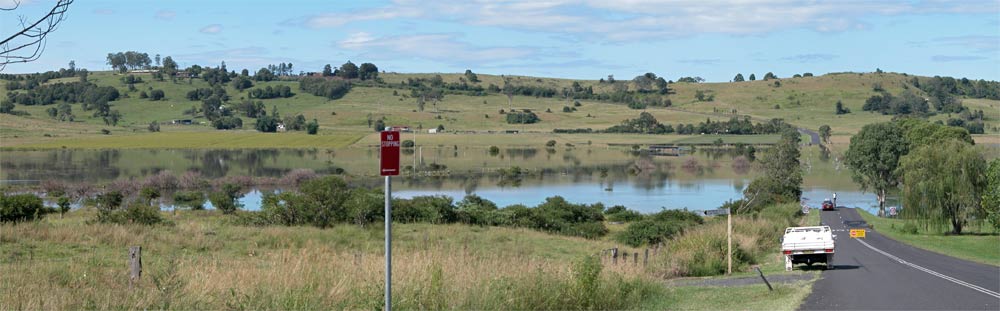
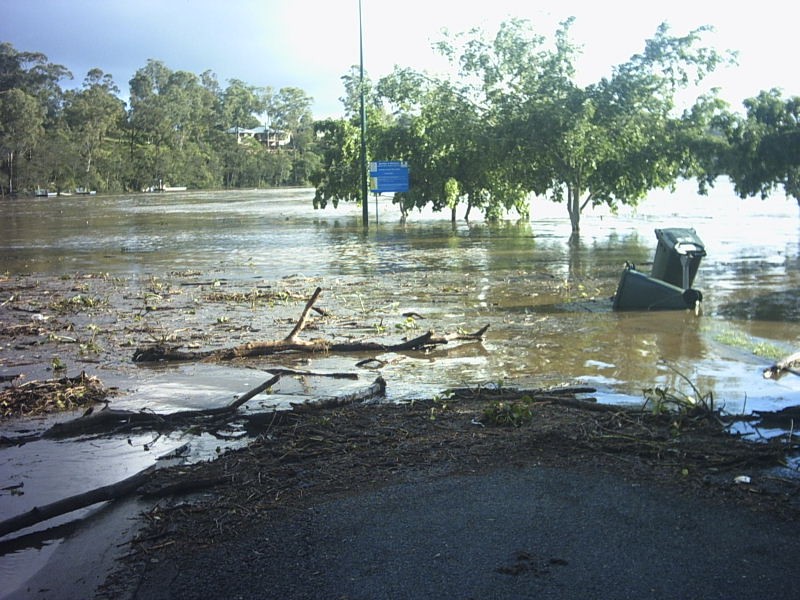
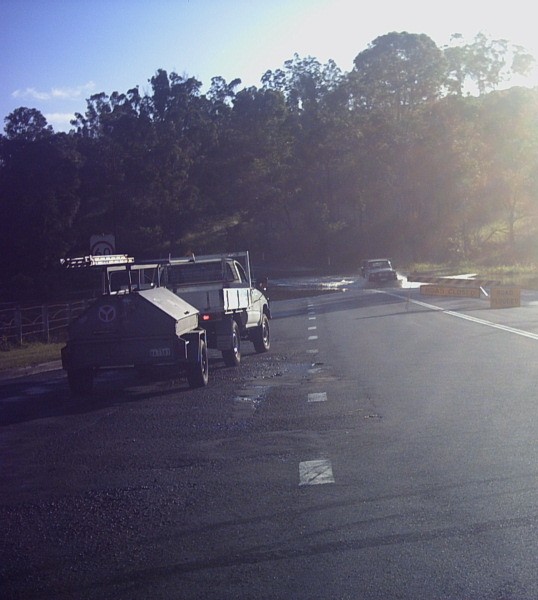
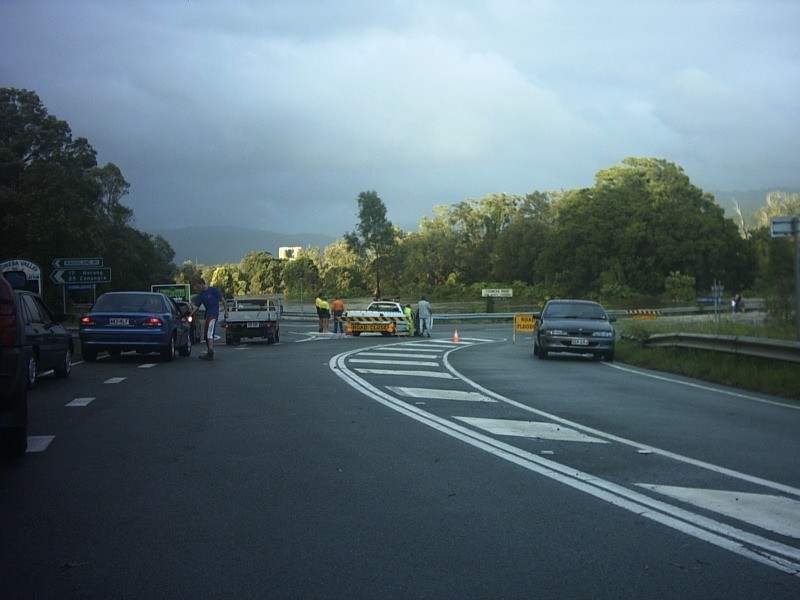
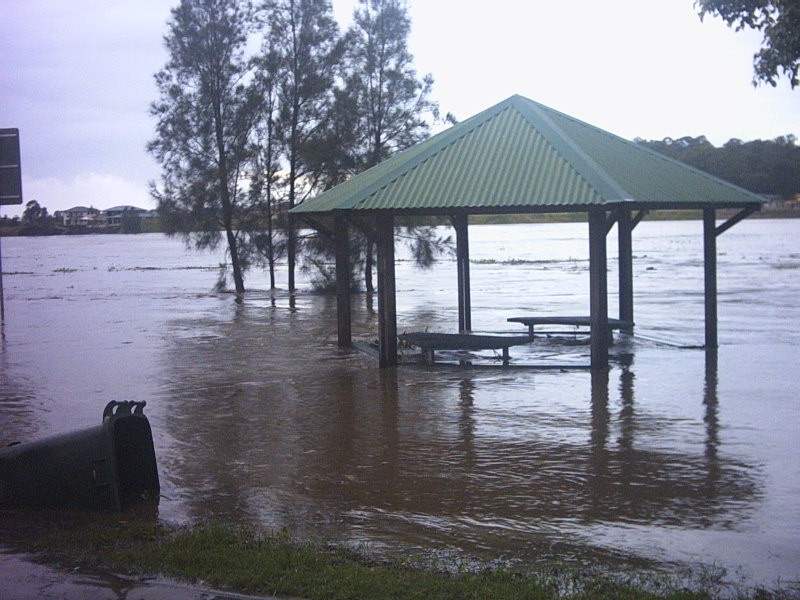
We then took the road from Eltham to Bexhill which is adjacent to the Wilsons River - one the two main streams which cause flooding problems in Lismore. At Bexhill, the road north of there was well under water from the Coopers Creek. We stopped and watched some people getting their stalled vehicle out of the floodwaters.
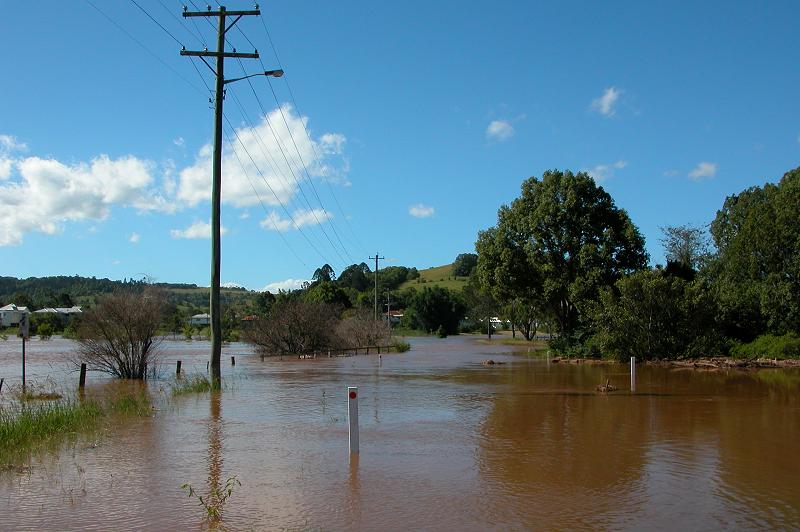
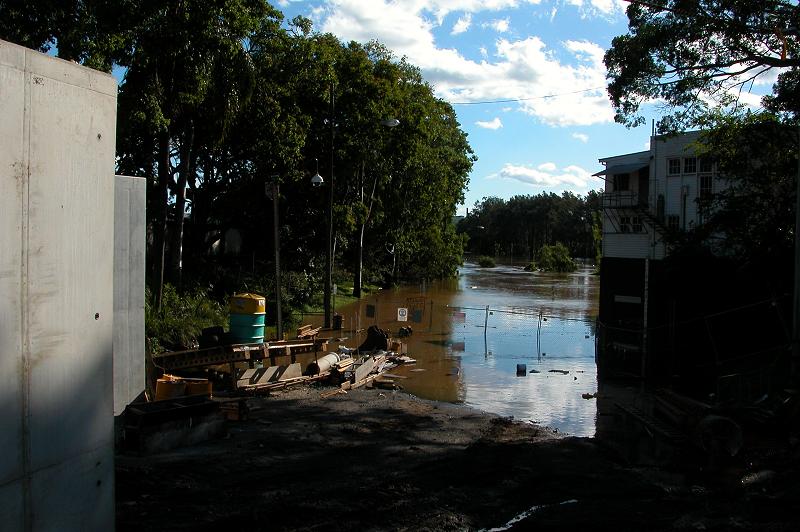
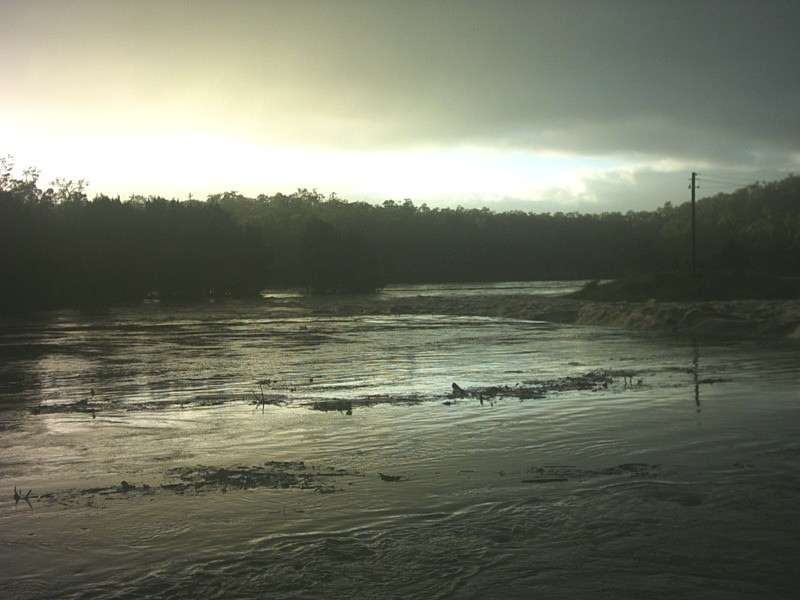
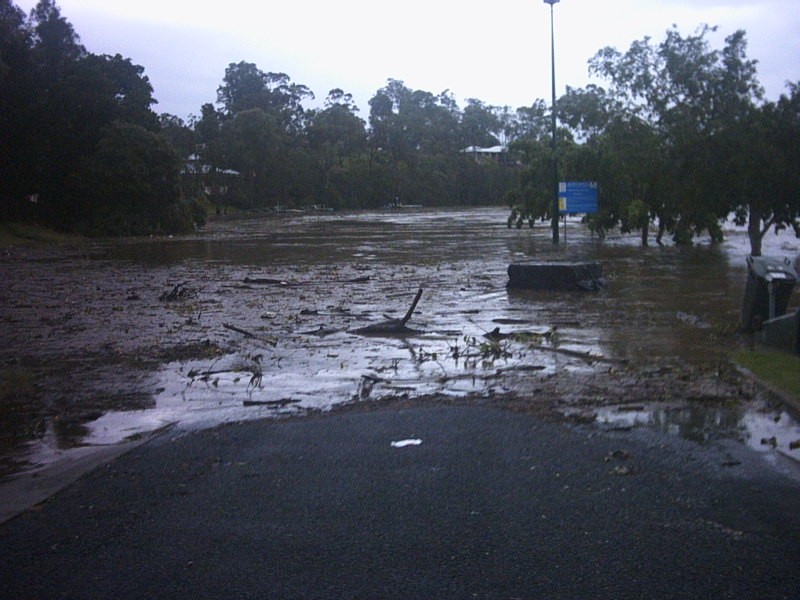
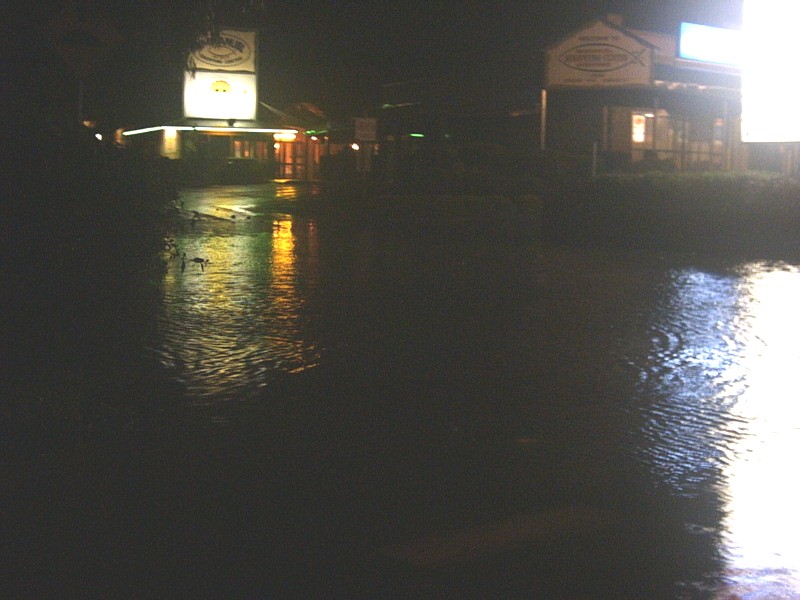
After that we drove to North Lismore where the waters were rapidly rising.
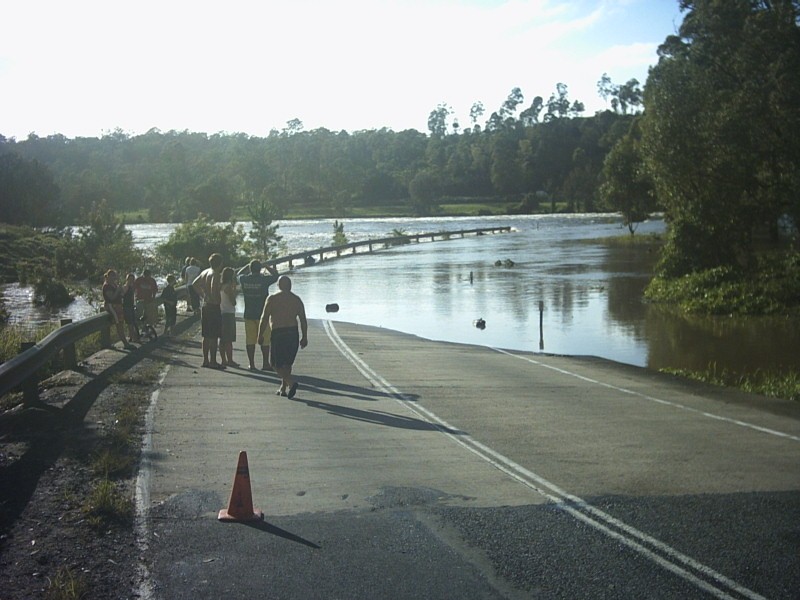
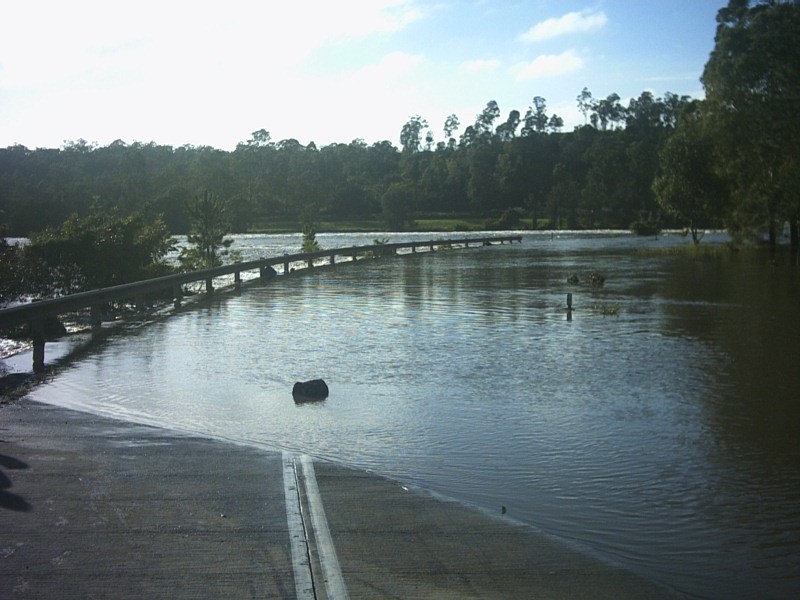
We headed out on the Nimbin Road where the bridge was just about to be cut.
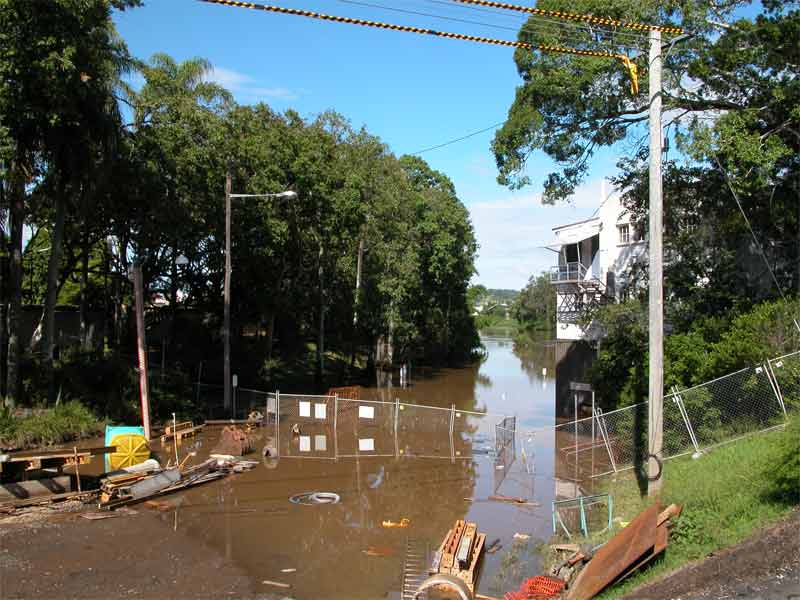
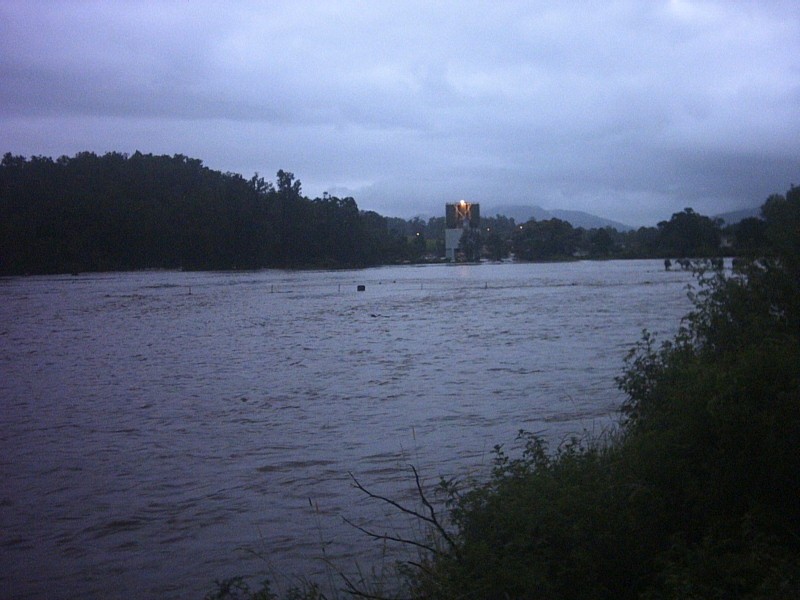
Back into Lismore we toured around a few more spots and inspected the new levee under construction. The levee will protect the CBD from most floods, but will be overtopped once the river reaches about 11 metres.
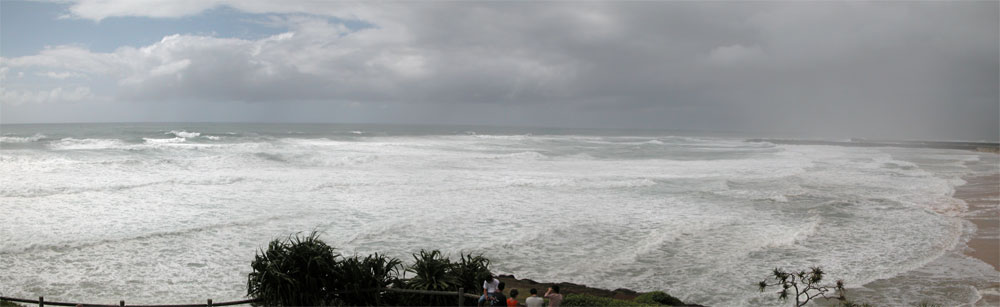
Ray Mullens took the surf shot at Ballina on Saturday afternoon, and the flood pics on Sunday 7th around Lismore
Jeffrey Higgins took these flood pics around the Coomera area of the Gold Coast.
Lead up
As early as 1/2 March 2004 the Computer Forecast models were forecasting an evolving pattern conducive to the development of intense hybrid storms off Southern Queensland. This pattern involved the development of a cut off 500hPa low just inland from Rockhampton while a monsoon trough was active in the Coral Sea. None of the models at any stage forecast 10m gales. The 850hPa winds (used by us as a proxy for 10m gales in these cases) indicated the possibility of storm force wind. These situations have been associated with past disastrous forecast failures (e.g. unwarned TC Annie hit the Sunshine Coast just to the north of Brisbane New Years Day 1963.)
So we started with outlooks of storm force winds on the coastal waters from Rockhampton to the Border at 5am 2 March 2004.
Warnings
The first warning issued was a gale warning at 00.20 pm 2 March 2004 for the high seas for a tropical low developing near northeast of Willis Island. At 5.11 am 3 March 2004 the warning areas were expanded south to include waters off the Gold Coast.
The first Coastal Waters gale warning for Bowen to Coolangatta was issued at 5am 3 March 2004.
The first storm warning was issued at 10am 4 March 2004 for coastal waters from Town of 1770 to Cape Moreton. This was extended south to Coolangatta at 3.11pm 4 March 2004.
The first Severe Weather Warning was issued at 4.12 am 4 March 2004 for Coastal and Mountain areas between Town of 1770 and Coolangatta. This was for wind gusts up to 120 km/h (later upgraded to 130km/h); ocean waves averaging 6 metres in height; heavy rain with local flooding and inundation from storm surge on the high tides on Friday 5 March 2004. These warnings were reissued every 3 hours and the Standard Emergency Warning Signal (SEWS) was turned on at 7.42 am Friday 5 March 2004.
The first flood warning for coastal rivers between Maryborough and the Gold Coast was issued at 3:02pm on Friday the 5th of March 2004.
Warning Strategy
Dynamically this system was developing in a similar fashion to a severe east coast low except for the fact it was moving over waters where the sea surface temperatures were 28 degrees Celsius. Often with these systems (Lord Howe Bomb June 2003 or the Sydney storm of 26/27 February 2004) quikscat show very tight circulations with at least storm force winds near the centre and gales right around the centre. If this was to happen we considered naming it as a TC. Because of the strong low up near Willis Island it developed as a very elongated system with no tight focus and as a result the strongest winds were well removed from the centre so that severe weather warnings appeared to be the way to go.
Fatalities
There may be 3 fatalities associated with this event. A man is missing in the flooded Mary River near Gympie, a 10-year-old boy who was drowned after being swept away from his family when they tried to cross a creek in the Tweed River catchment; and an elderly woman drowned in a creek near Nambucca Heads (South of Coffs Harbour).
Rescues
Two people were rescued from a 4WD in a flooded creek on the northern Gold Coast. Five people were rescued from the top of their car in a flooded stream near Caboolture north of Brisbane. At Bundamba near Ipswich two girls fell into strong rapids and were rescued by Police. At Murphys Creek near Toowoomba fire-fighters rescued a stranded motorist. Five people were rescued after they were swept into the sea by the run up from large waves. In Moreton Bay a French yachtsman was rescued after an air and sea search.
Power outages
Around 106,000 customers are lost power during the storm.
Building, environmental and infrastructure damage
The State Emergency Services (SES) says its crews were called out to about 200 jobs across the Brisbane area, 80 on the Gold Coast and 70 on the Sunshine Coast. Most were minor roof damage and sandbagging requests. Police say there were many trees and power lines down across Brisbane, the Gold Coast, the Sunshine Coast, Ipswich and Toowoomba. On the Gold Coast, police say some cars became bogged in flooded roadways, although there are no reports of any injuries. The Warrego highway at Cunningham's Gap, west of Brisbane, was closed due to rockslides. Four metres of roadway were washed away on Sydney Street at Brassall in Ipswich as a bus passed over it.
Waves and storm surge
Very large long period waves were generated by the storm. Waves with significant wave heights of almost 6m and maximum heights of almost 12 m were recorded on the Mooloolaba wave rider buoy around 4pm Friday 5 March 2004. On the buoy off Stradbroke Island the corresponding readings were 7.1m and 14.3m around 5pm 5 March 2004 and coming from the east northeast. The peak height measured on the Tweed Buoy was just over 14m and this occurred 3am Saturday 6 March 2004.when the significant wave height was between 5 and 6metres. The wave periods were almost 13 seconds and approached from the east-northeast.
Even in Moreton Bay a Maximum wave height of over 3.5 metres was measured around 1am Saturday 6 March 2004.
The worst effect from storm surge appears to be on the Friday nights high tide at Currumbin on the Gold Coast when cars were floated around the car park. At present a car is being dragged from the ocean near Bilinga on the Gold Coast. This was not a big tide (0.74m below the Highest Astronomical Tide. (HAT)) and therefore the wave effects appear to have added over a metre to the tide.
Northeasterly gales in Moreton Bay early on Saturday raised the level of the Bay 0.6 metres. The winds eased somewhat but still water levels almost reached HAT on the 9.47am high tide Saturday. This combined with waves caused inundation of low-lying areas.
Significant observations
Cape Moreton 94594 strongest winds were at 3pm 5 March 130/56knots (10 min mean) and max gust 67knots. Note these Almos automatic weather stations (AWS) appear to have very low gust factors compared with the old Dynes anemometers. Cape Moreton reported storm force winds from 10.57am to 03.30pm 5 March.
Double Island Point (94584) also reported storm force winds from 11.30am to 1.30pm 5 March 2004 from the south-southeast. The maximum 10-minute mean was 49 knots.
The Gold Coast Seaway reported southeasterly gales from 2pm to 8pm 5 March with maximum gusts to 50 knots and then easterly gales from 10.30 pm 5 March 2004 to 2am 6 March 2004.
Moreton Bay South (AWS) reported southeasterly gales from 3.55pm to 5.18pm 5 March 2004 with maximum gusts to 49 knots. And east northeasterly gales around 1am 6 March 2004.
Moreton Bay Central (AWS) reported southeasterly gales from noon to 5.28pm 5 March 2004 with maximum gusts to 56 knots. Then easterly gales from 7.49pm to 10.17pm 5 March 2004. Then easterly gales turning north/northeasterly from 0011 am 6 March 2004 to 1.30am 6 March 2004 with maximum gust s to 51 knots.
Moreton Bay North (AWS) reported southeasterly gales from 1.04pm to 4.30pm 5 March 2004 with maximum gusts to 46 knots.
Redcliffe (AWS) reported south to southeasterly gales from 1.00pm to 5.33pm 5 March 2004 with maximum gusts to 49 knots. Then east and east to northeasterly gales from midnight to 1.22am 6 March 2004.
Heron Island (AWS) reported gales from the south-southwest from 10.35am 5 March 2004 4pm 5 March 2004 with max gusts to 49 knots.
Rundle Island (AWS) reported southerly gales from 7.30am 5 March 2004 noon 5 March 2004 with max gusts to 50 knots.
Cato Island (94394) AWS reported southeasterly gales from 11pm 4 March 2004 to 4am 5 March 2004.
Frederick Reef (94393) AWS reported southeasterly gales from 3pm 4 March 2004 to 1am 5 March 2004 with the maximum 10 minute wind of 39 knots.
Gannet Cay (94379) AWS reported south to southwesterly gales from 8am 5 March 2004 to noon 5 March 2004 with the maximum 10 minute wind of 42 knots.
Rainfall
24 hour rainfall totals to 9am Saturday 6 March 2004 included
TOMEWIN 284.0mm SPRINGBROOK 259.0mm MALENY 239.0mm O'REILLYS ALERT 236.0mm TAMBORINE 226.mm MT MEE 225.mm MT GLORIOUS 221.6mm TALLEBUDGERA CK 197.mm CANUNGRA 196.2mm HINZE DAM 194.0mm MT NEBO 190.6mm COOROY 182.6mm FERNY HILLS 180.0mm LAKE MANCHESTER 176.0mm BEERBURRUM 169.6mm STRATHPINE 169.0mm MORAYFIELD 164.2mm EUMUNDI 161.0mm WOODFORD 157.0mm HIGHVALE 155.2mm PETRIE 154.0mm MITCHELTON 150.0mm EVERTON HILLS 148.0mm REDCLIFFE 144.0mm SAMFORD 134.mm
From Bureau
of Meteorology.
|
Document: 200403-01.htm
Updated: 6th September 2005 |
[Australian Severe Weather index] [Copyright Notice] [Email Contacts] [Search This Site] |