and Chasing
[Index][Archives]
Storm Chase with Microbursts near the Richmond Range: Sunday 20th November 2005
Report compiled by Michael Bath
| Storm News and Chasing [Index][Archives] |
Storm Chase with Microbursts near the Richmond Range: Sunday 20th November 2005 Report compiled by Michael Bath |
Shear was rather poor on this day and low level moisture a bit marginal. Upper temperatures were quite good, but short lived cells were all that were expected today.
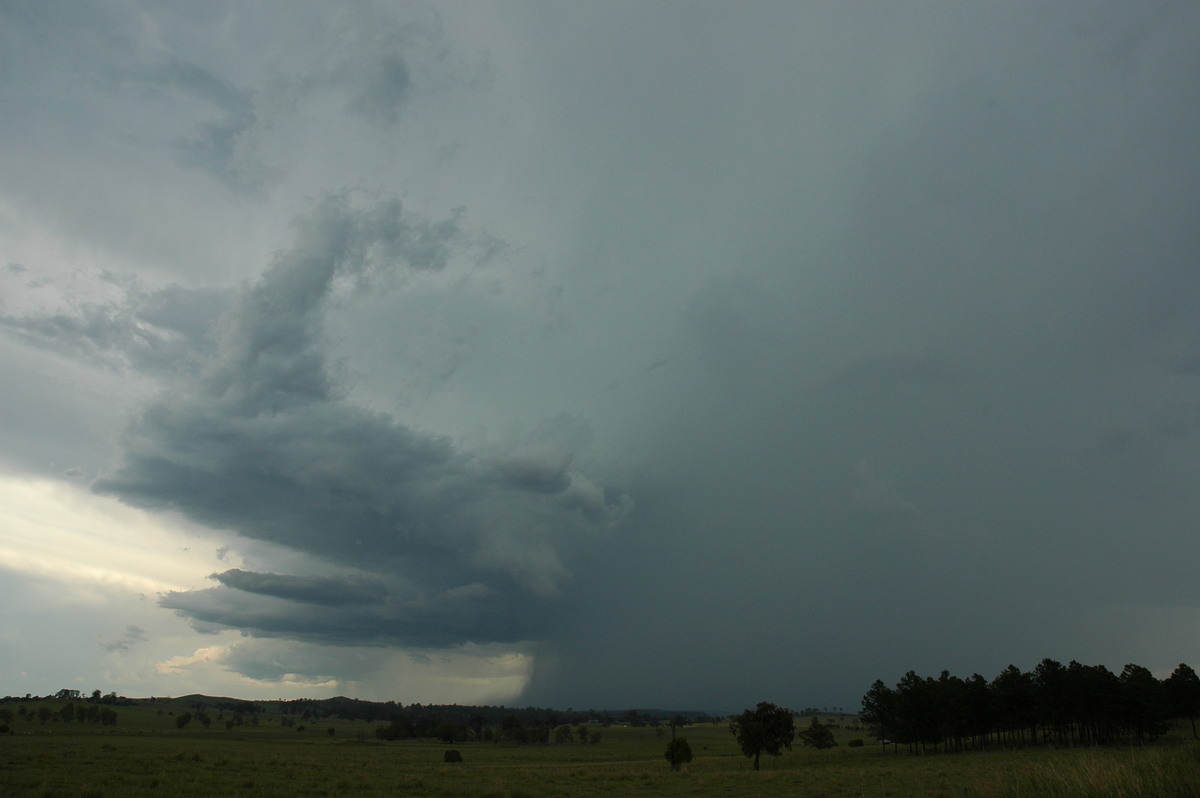
Dave Ellem and I headed out and arrived just west of Casino about 1.30pm. Storms were already active on the eastern parts of the Northern Tablelands, and a new cell had gone up on the Richmond River just to our west.
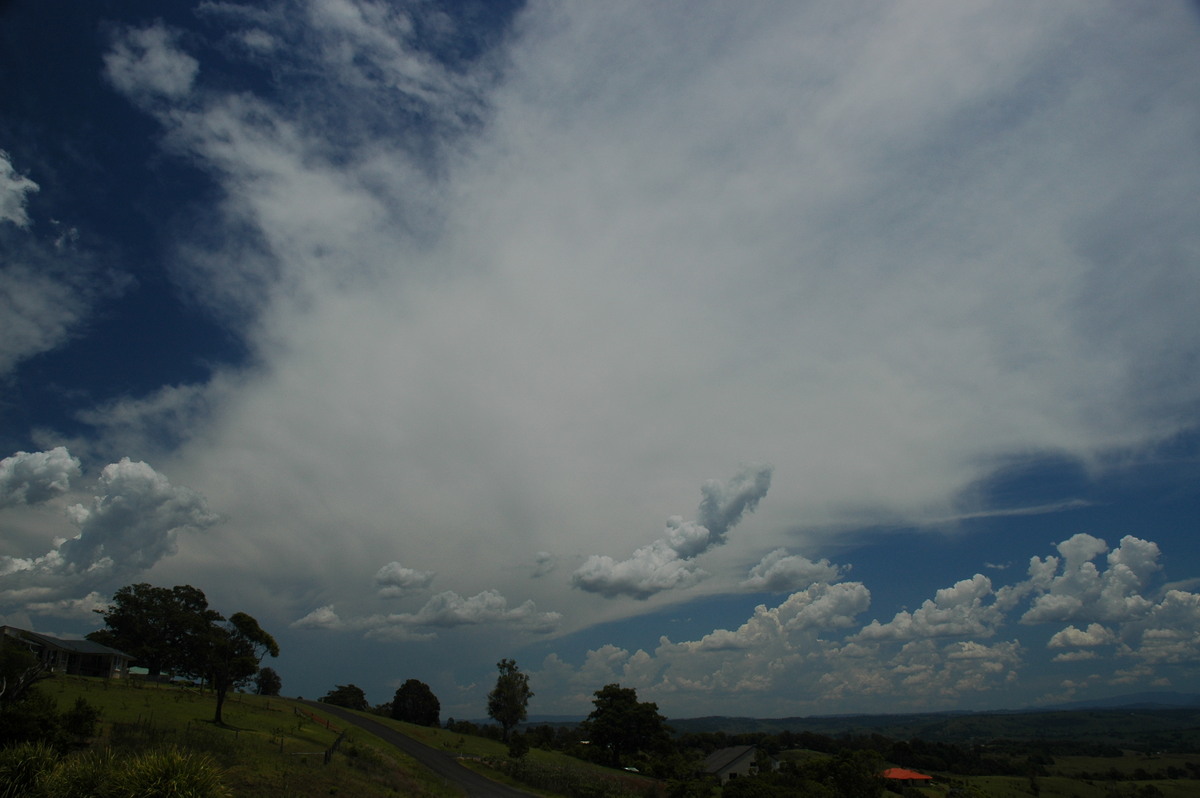
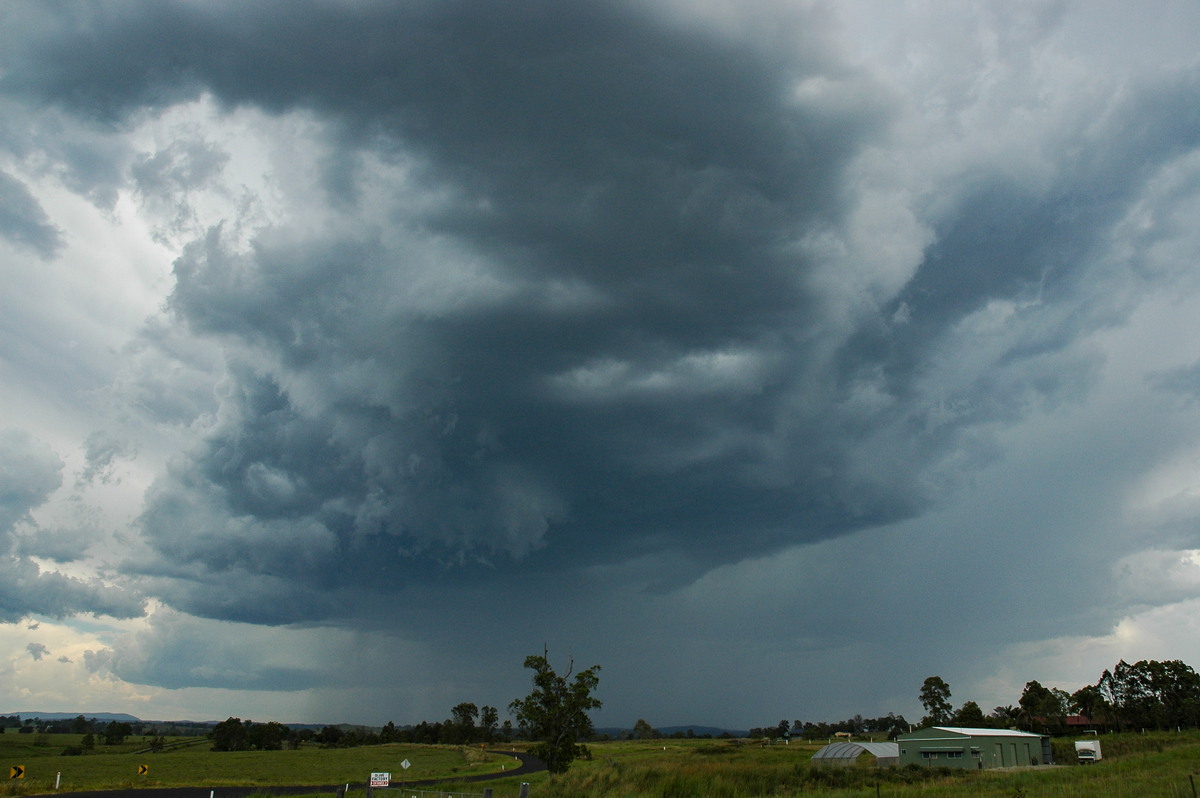
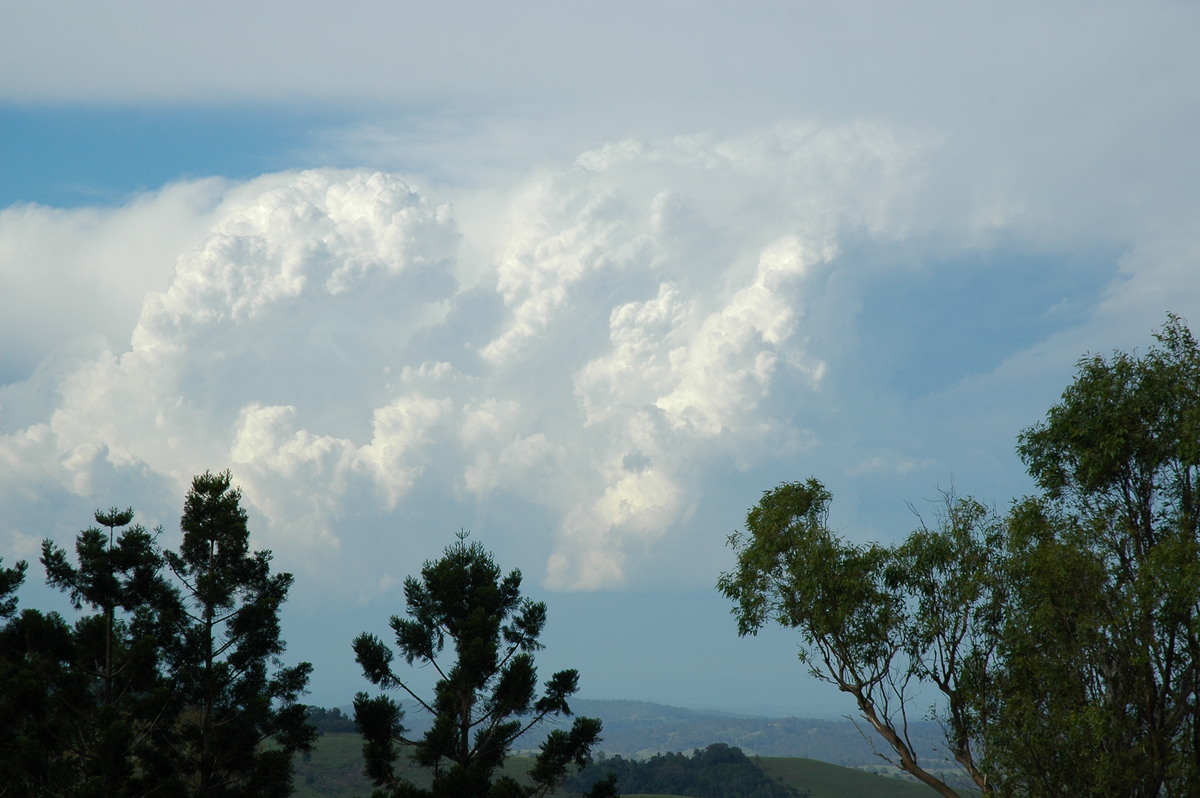
Base features became quite interesting and had it not been for anvil cloud from storms further west, may have organised a little further. Strong looking updrafts formed on the cell's southern side along with CG lightning.
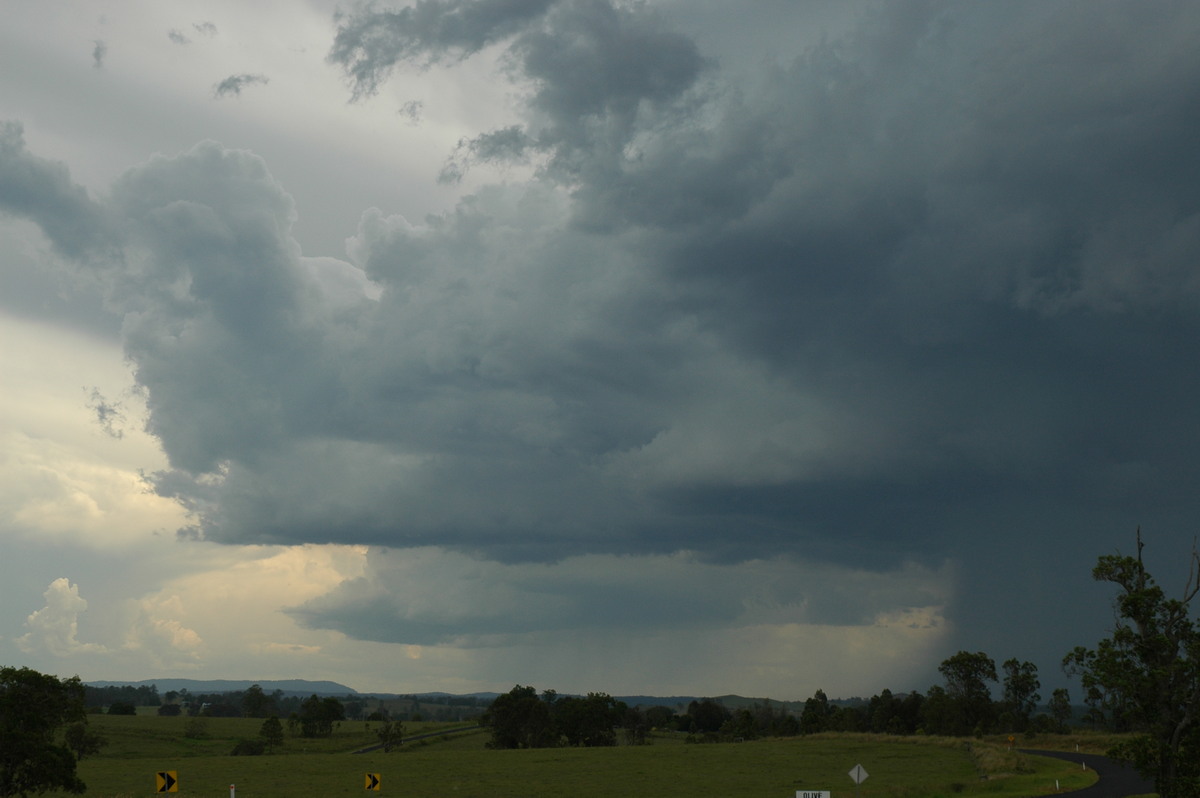
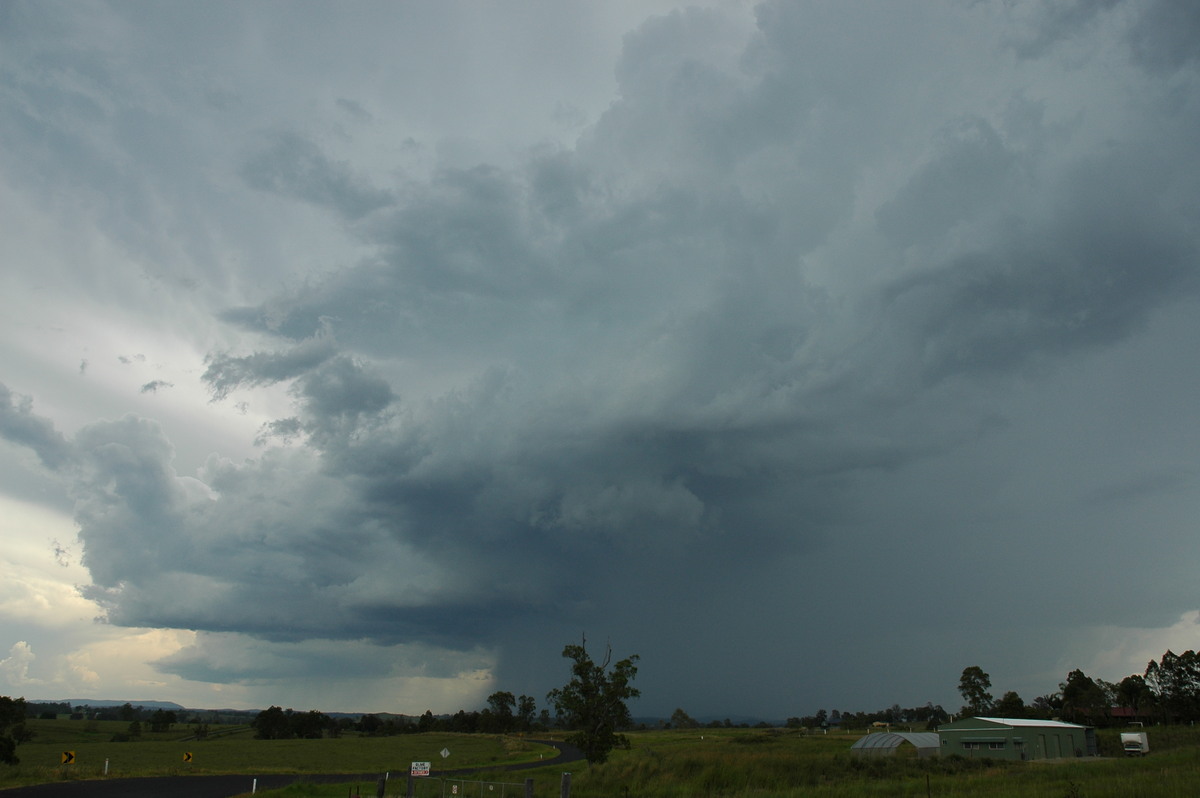
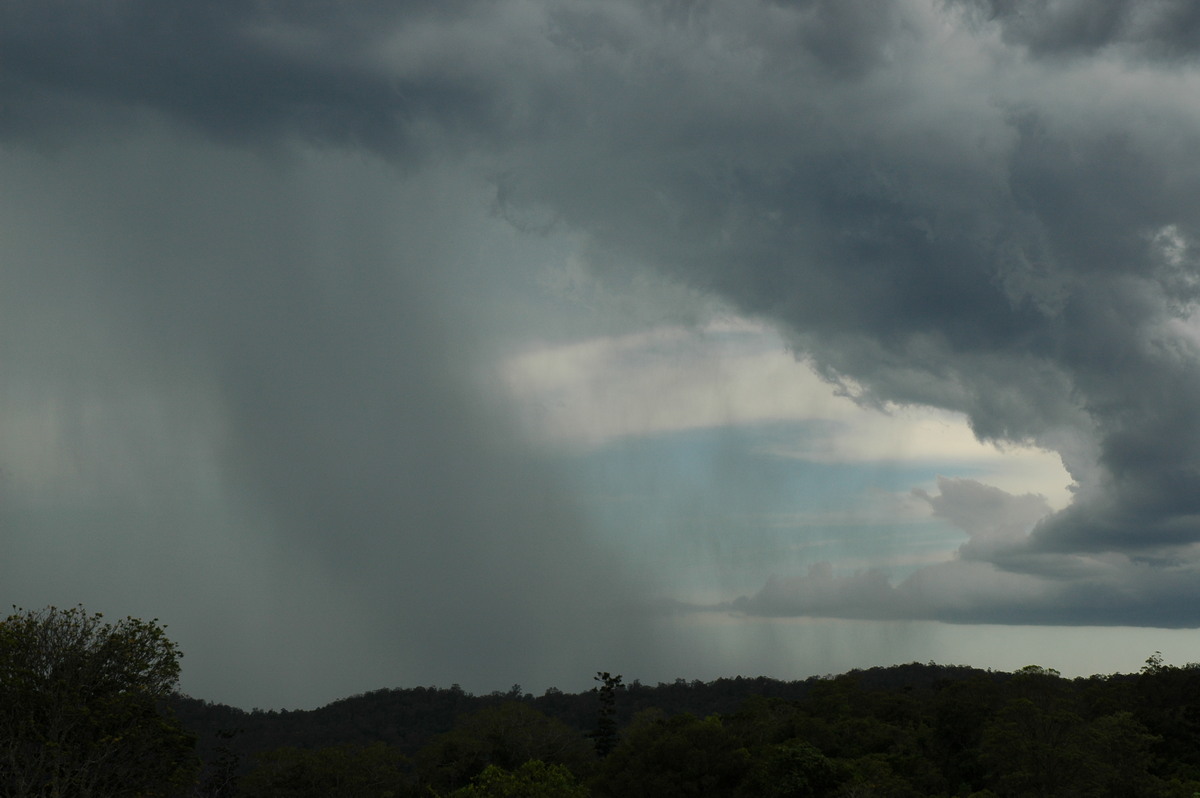
Heavy rain with a microburst soon developed. Seeing as though it was close to the Bruxner Highway we decided to head west under the precipitation to see if any hail was falling. Some very large drops were observed with moderate rain but the storm was already dying by the time we passed under it.
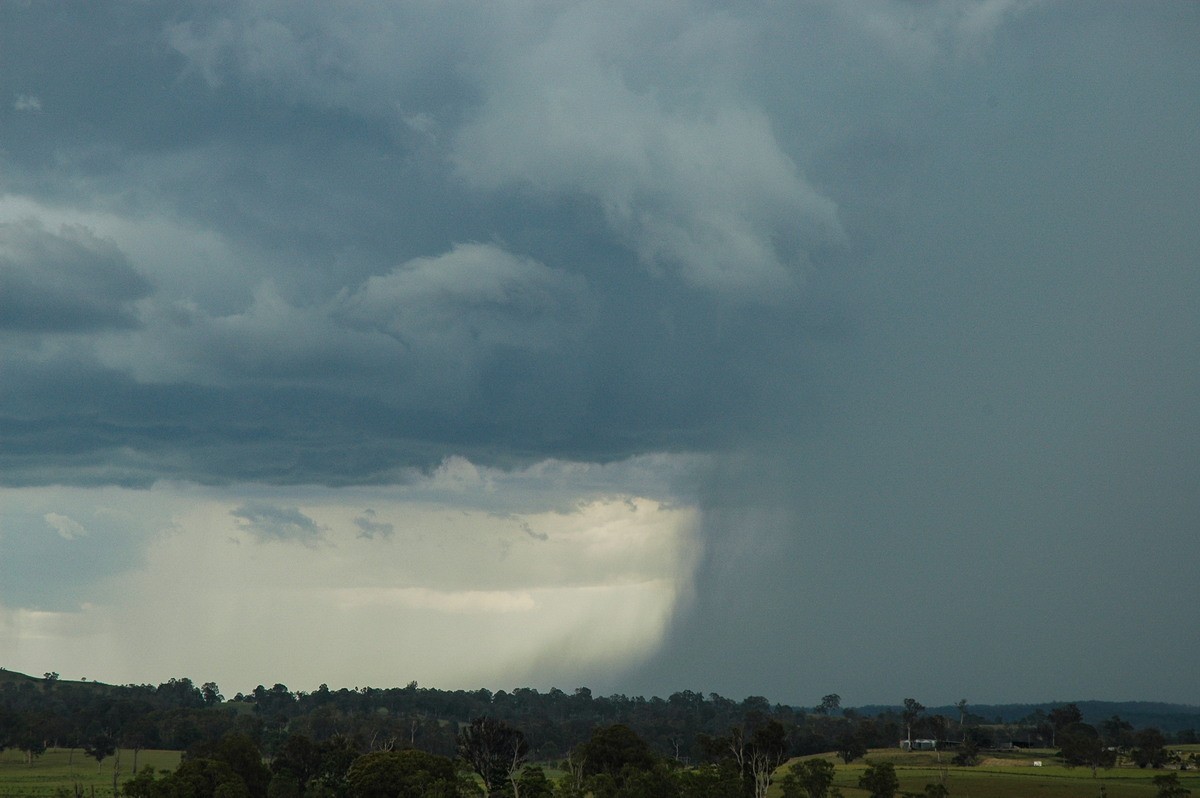
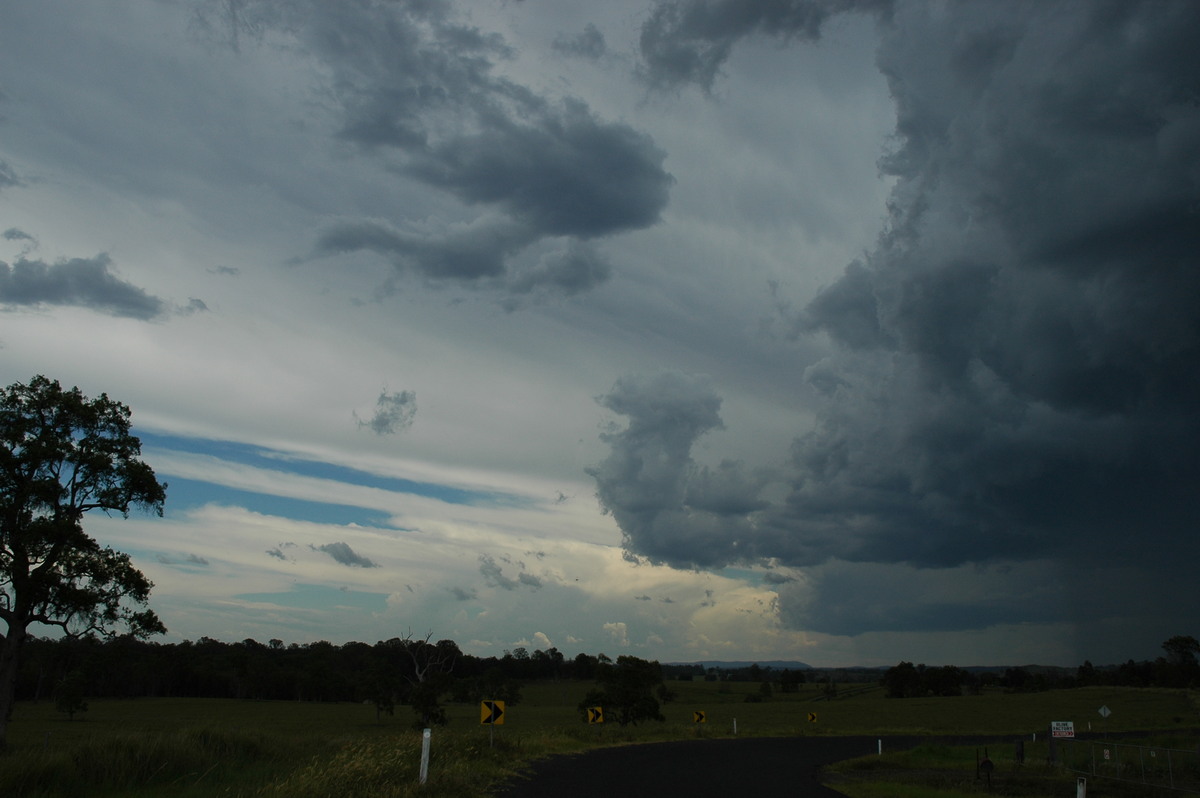
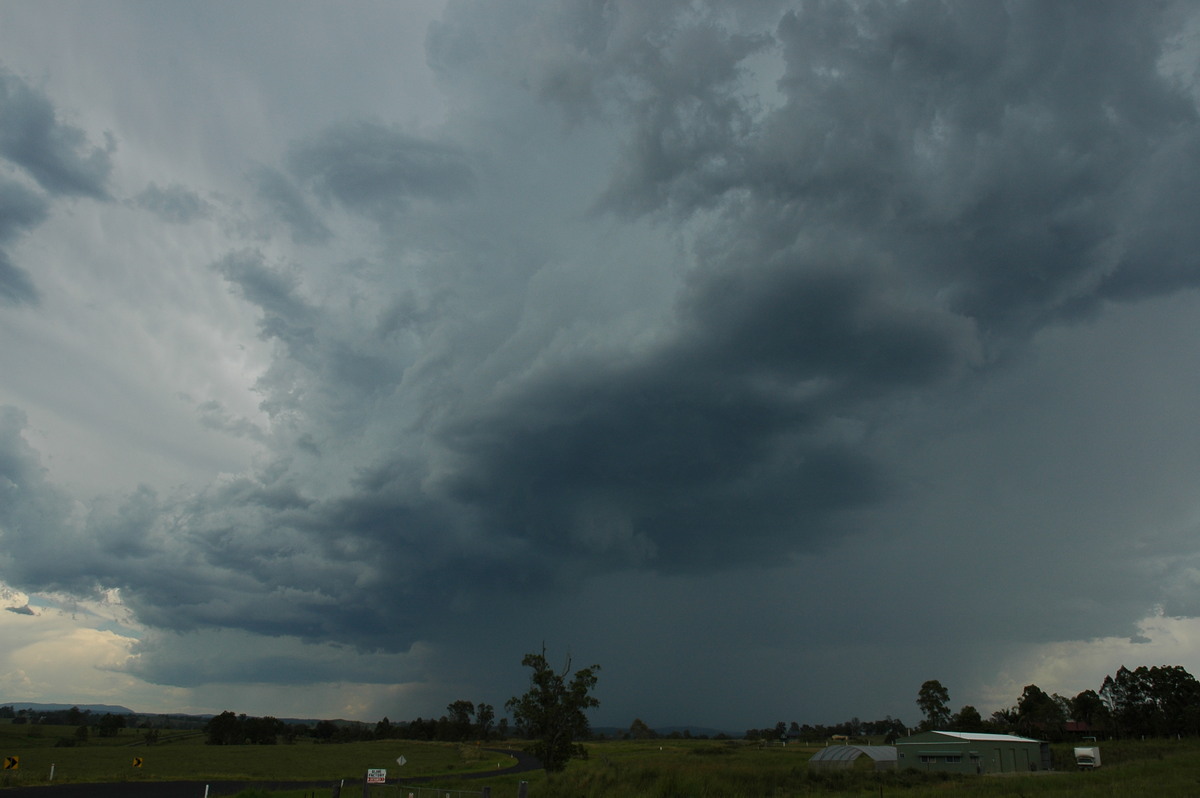
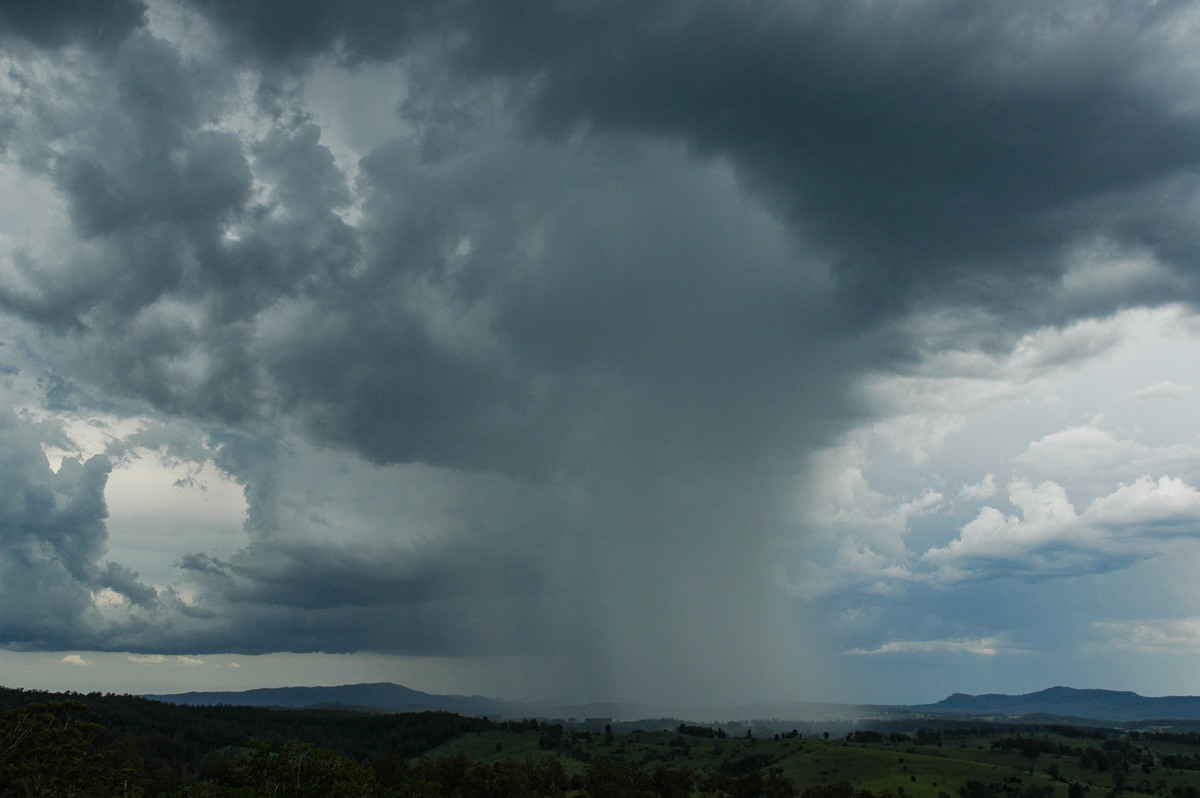
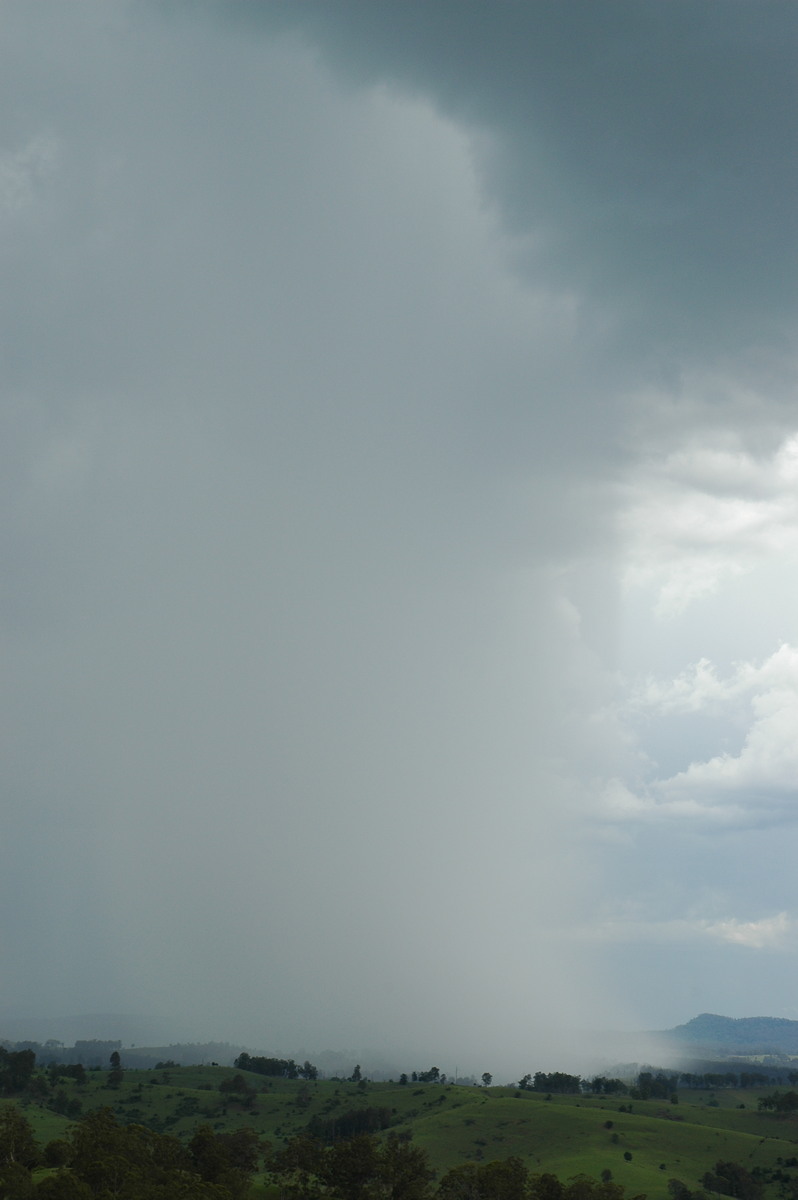
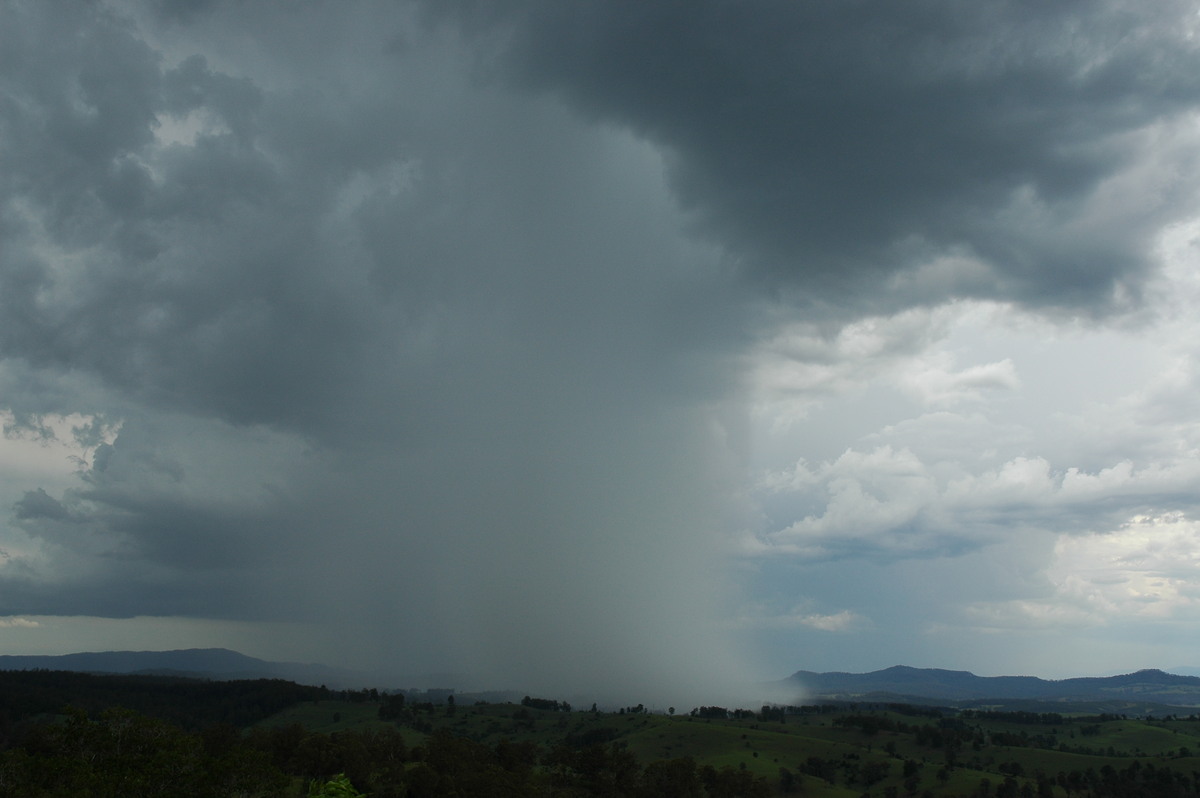
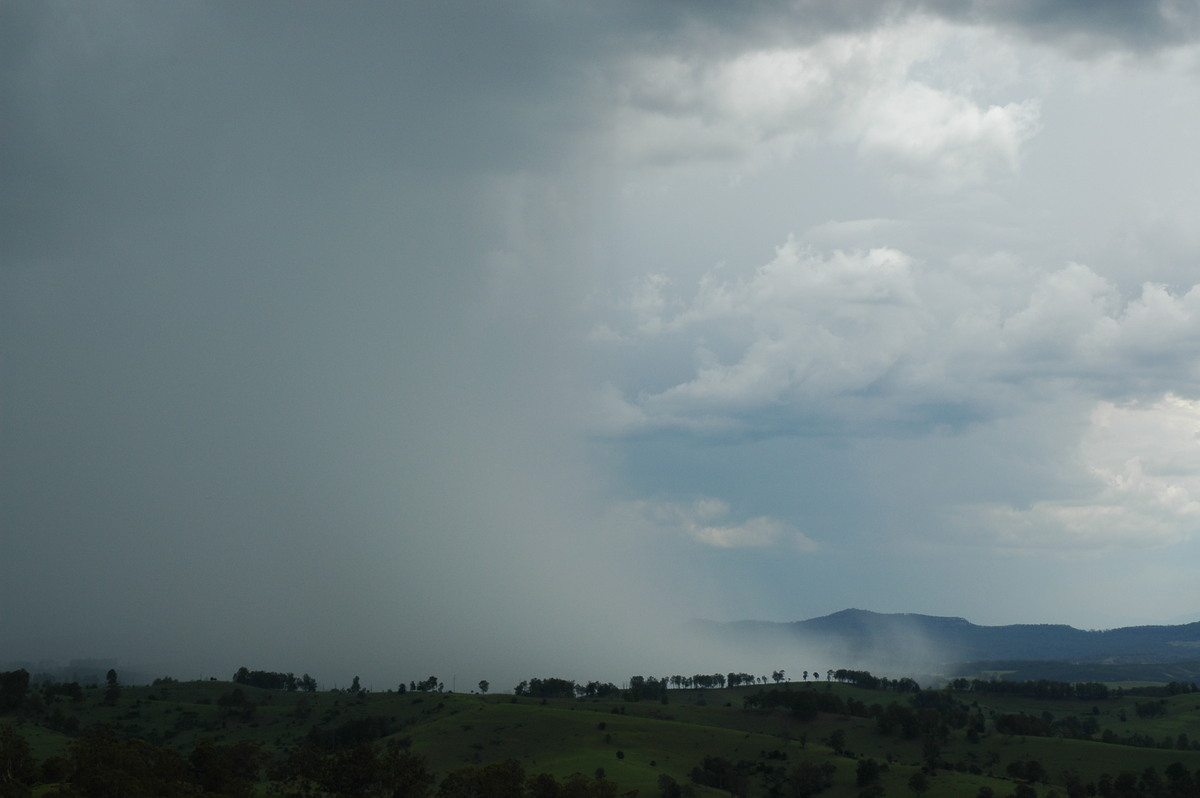
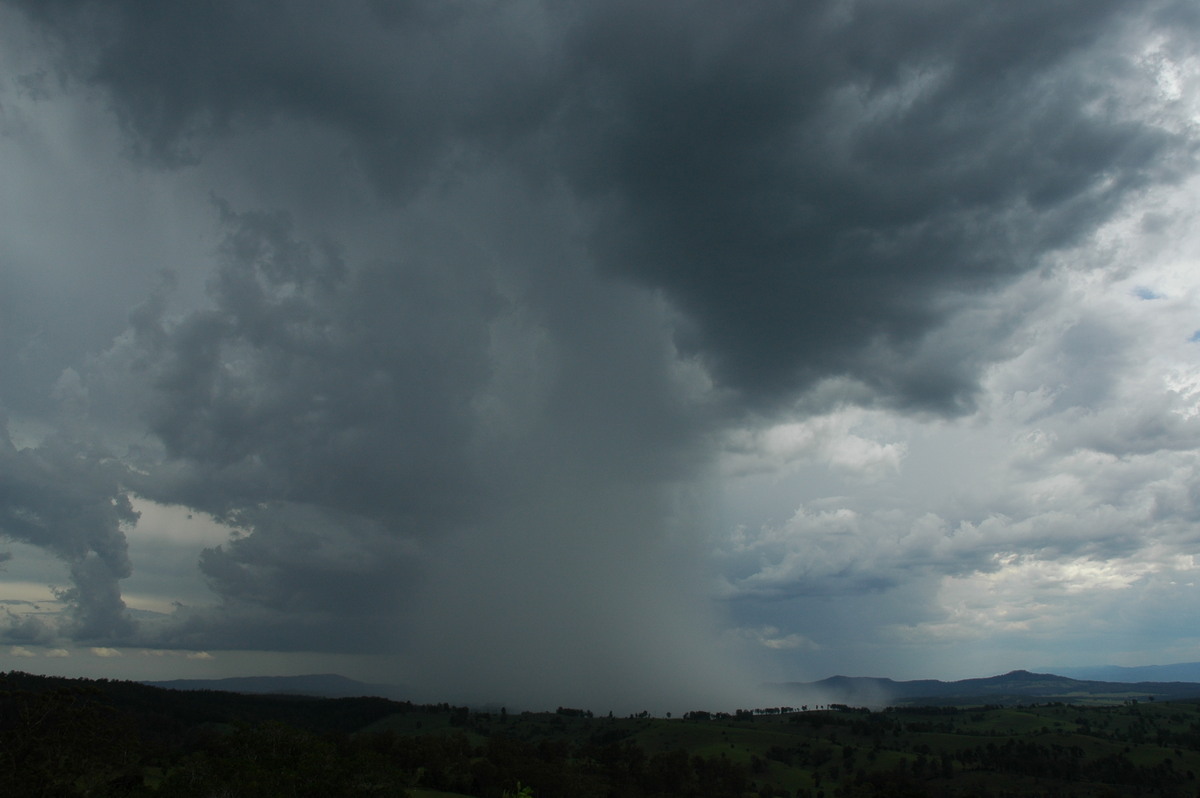
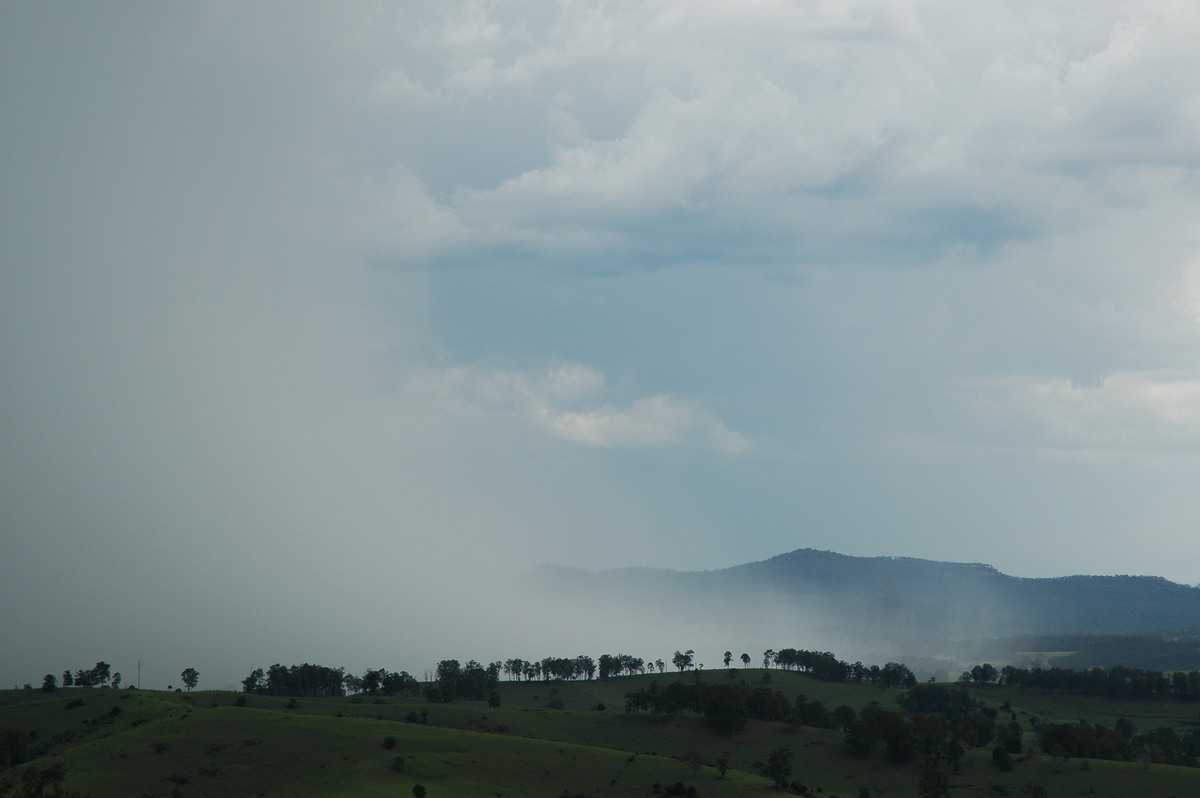
From the Mallanganee lookout we watched a small cell develop a few kilometres to the SW. The storm itself was not impressive but the precipitation shaft sure was! It was very dramatic to see a nearby microburst from an elevated position.
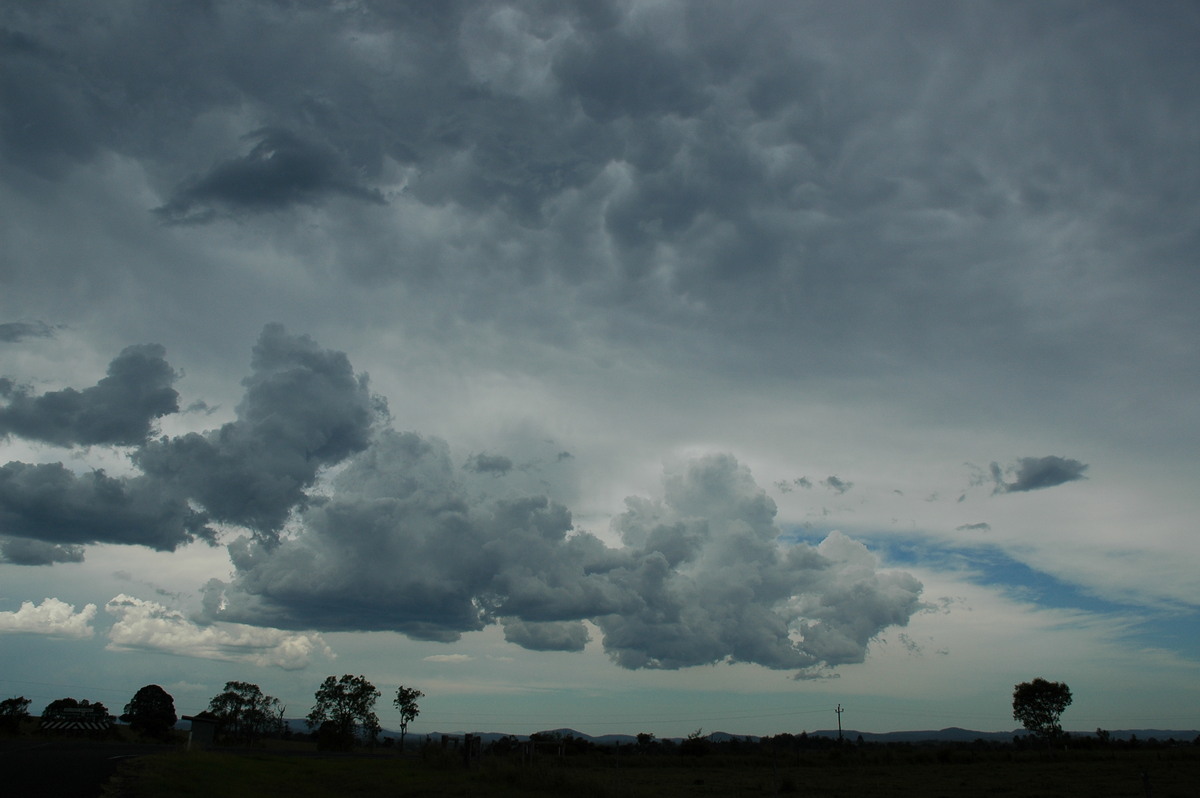
After this cell died, some other nice updrafts formed to the north on the Border Ranges, but it was all over locally and we called it quits soon after 4pm.
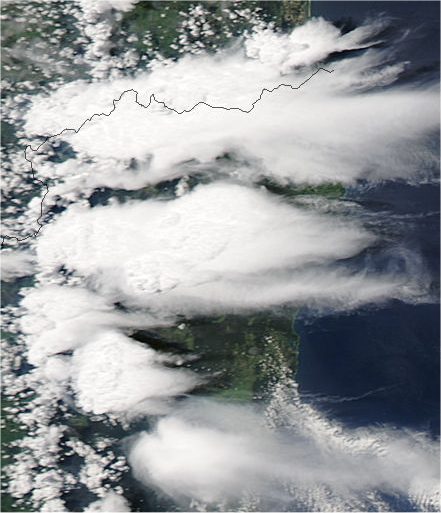
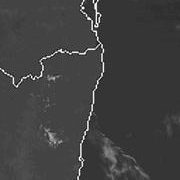
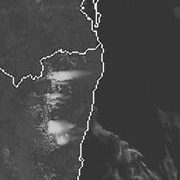
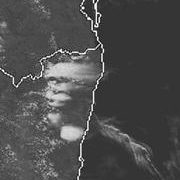
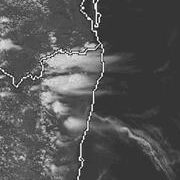
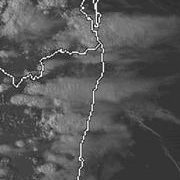
From Weatherzone and MODIS: Land Rapid Response System
 2pm local
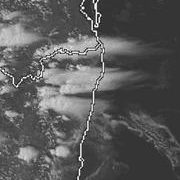
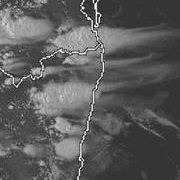
 11am to 5pm local
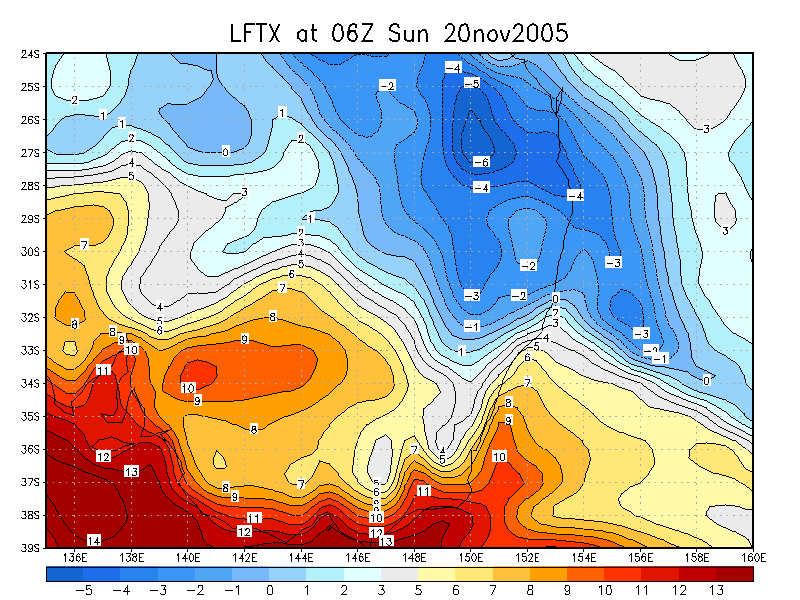
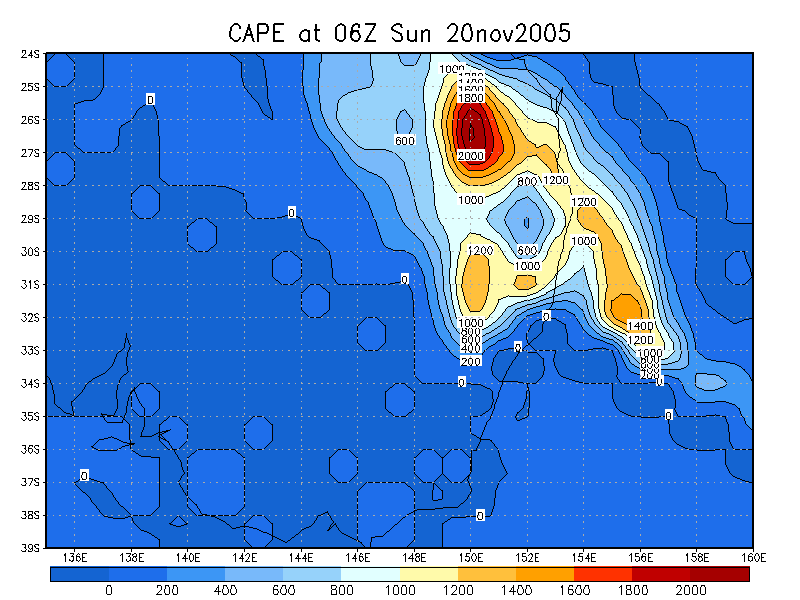
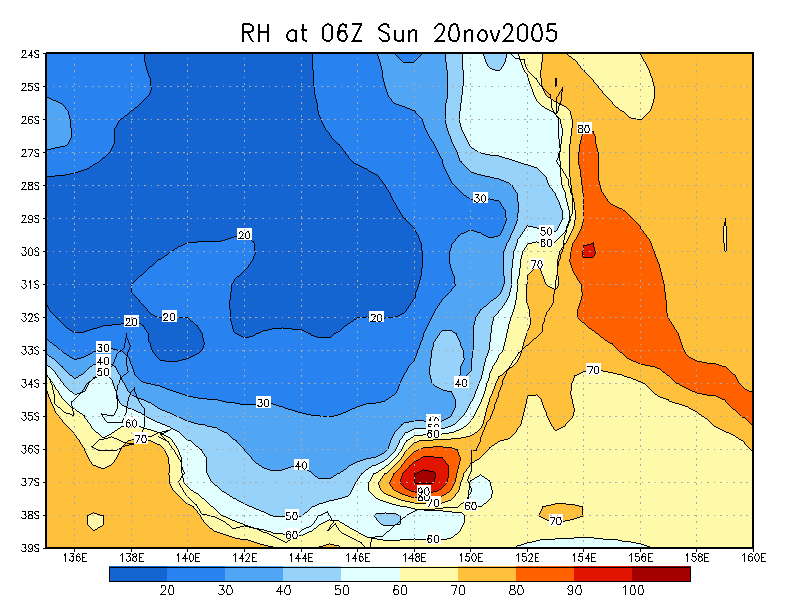
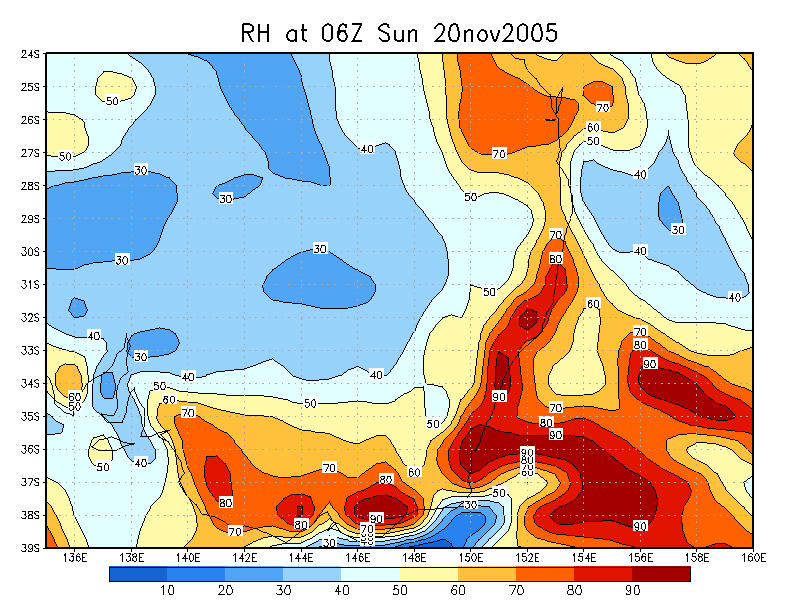
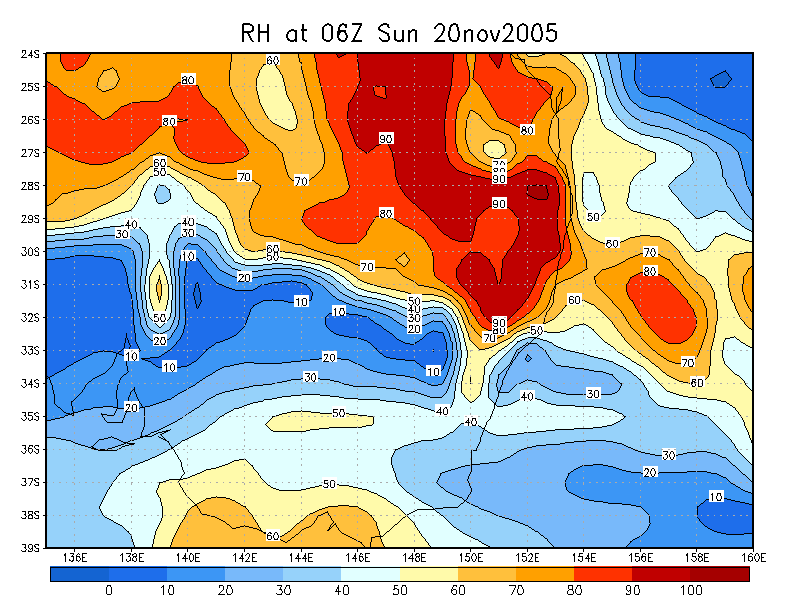
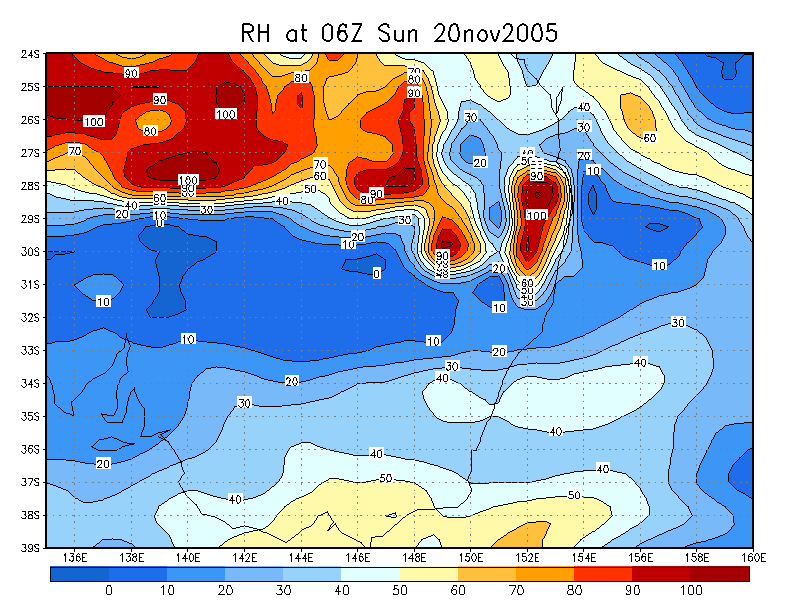
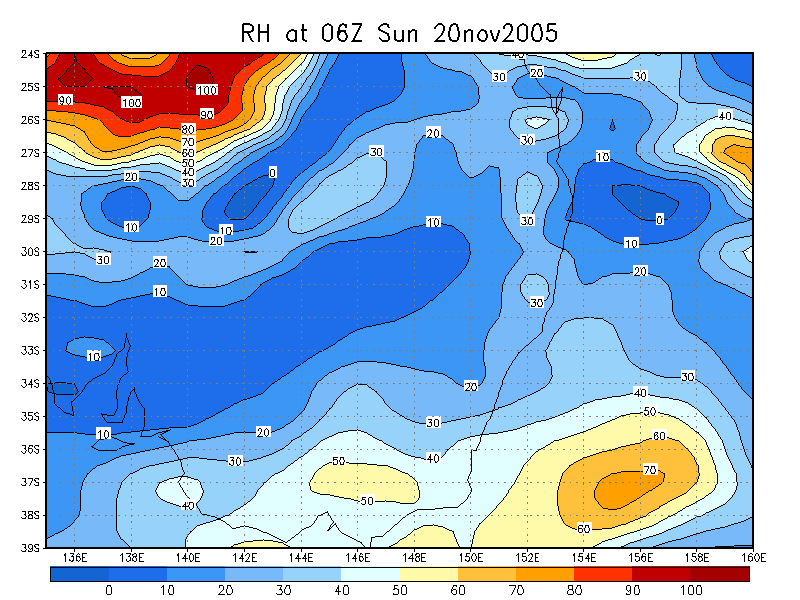
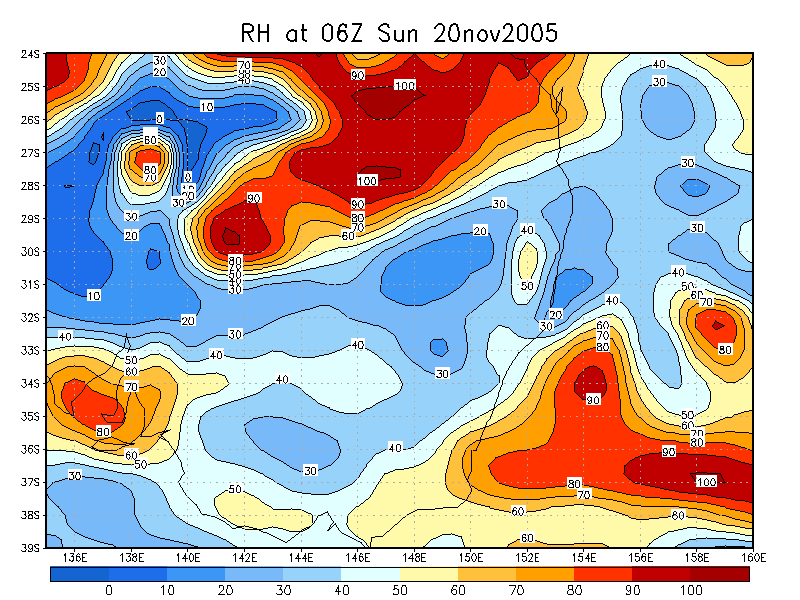
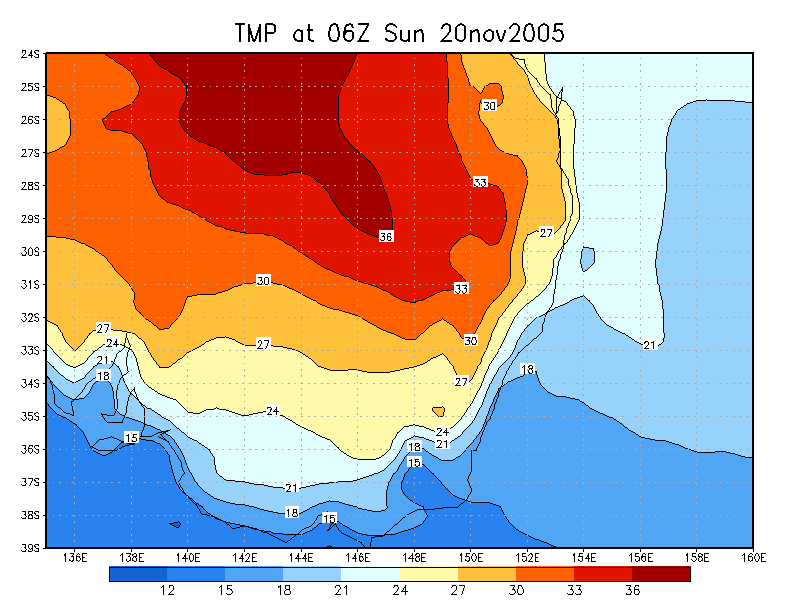
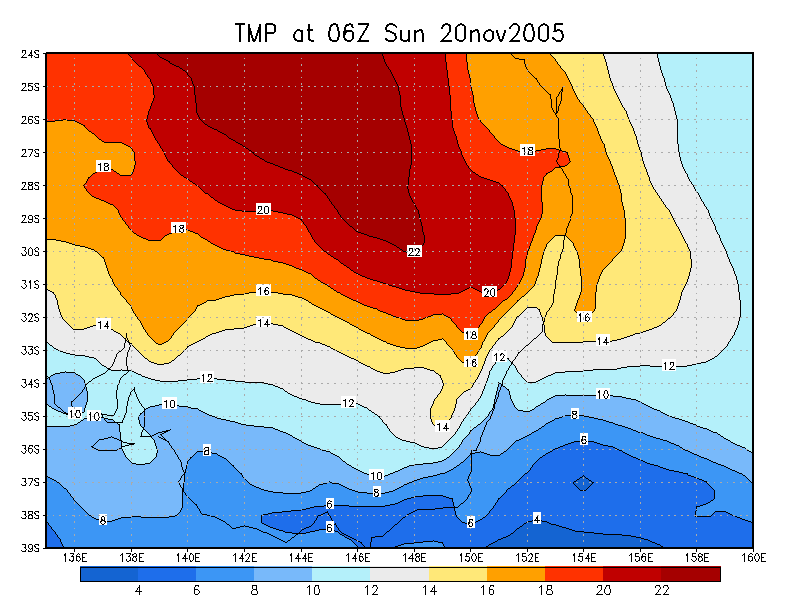
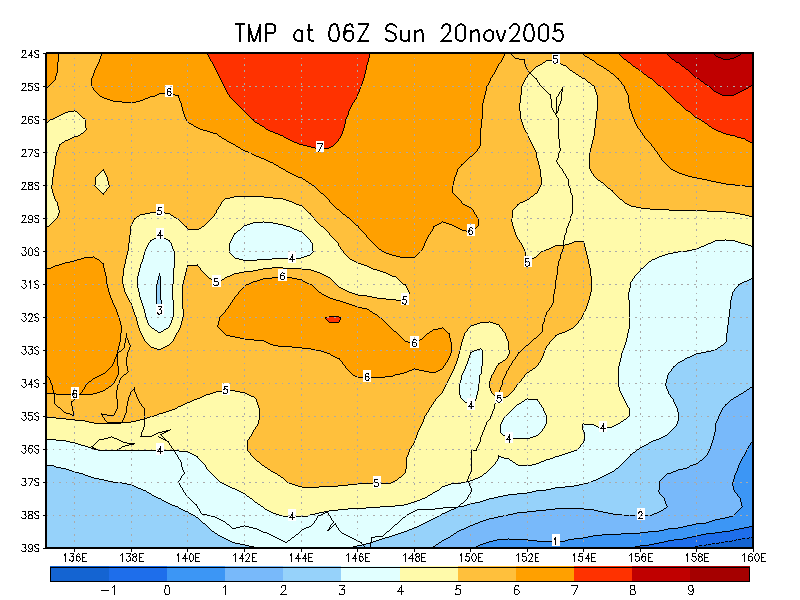
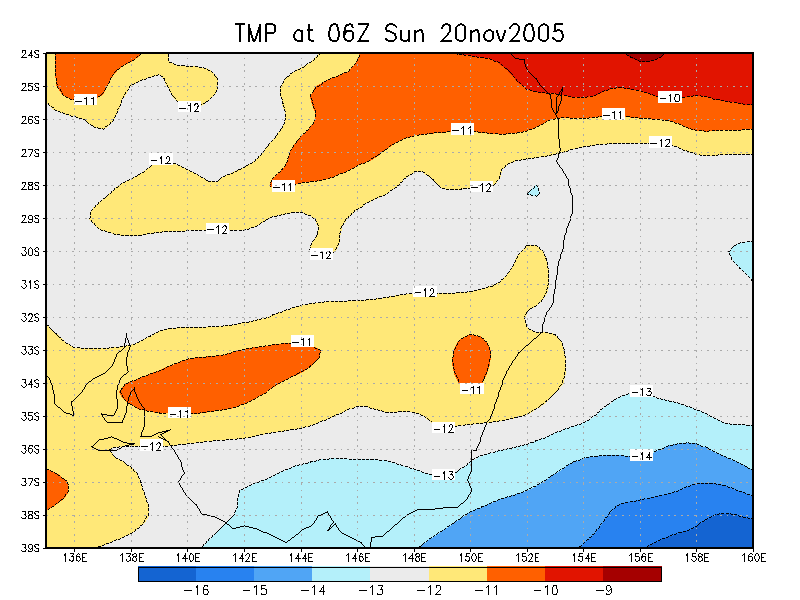
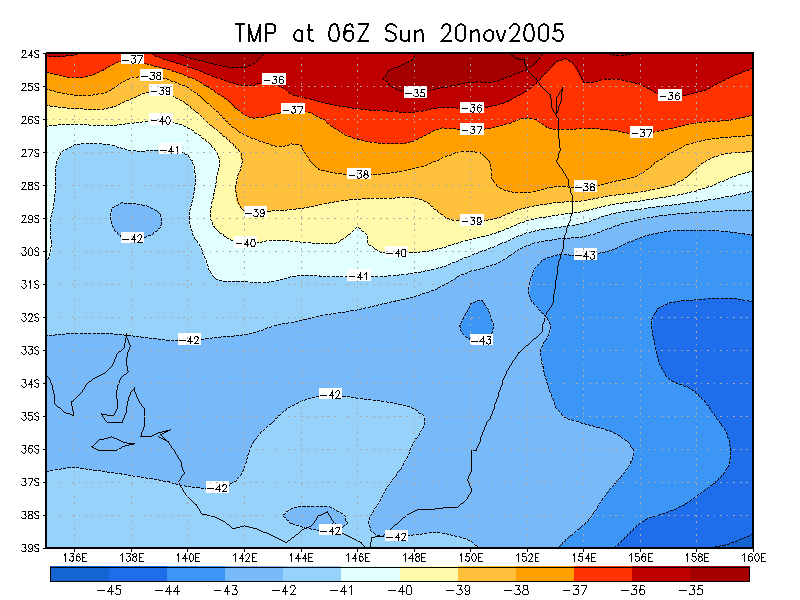
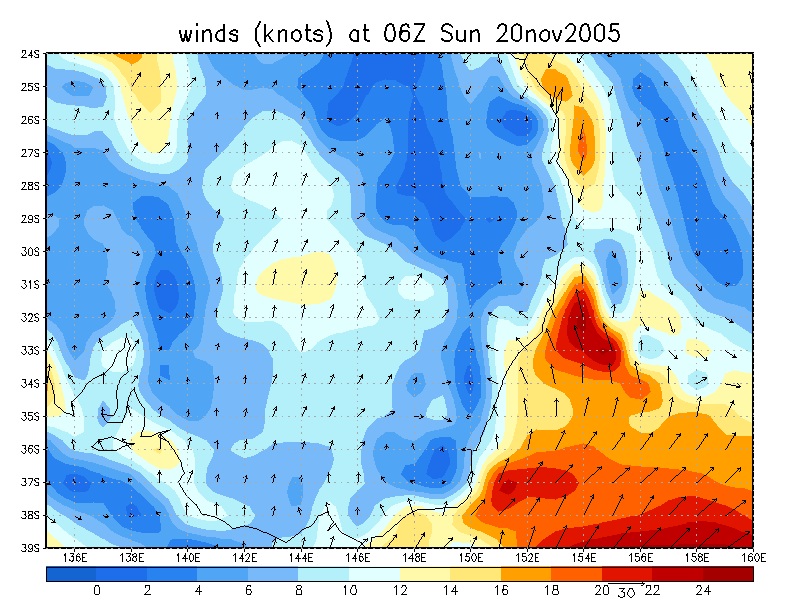
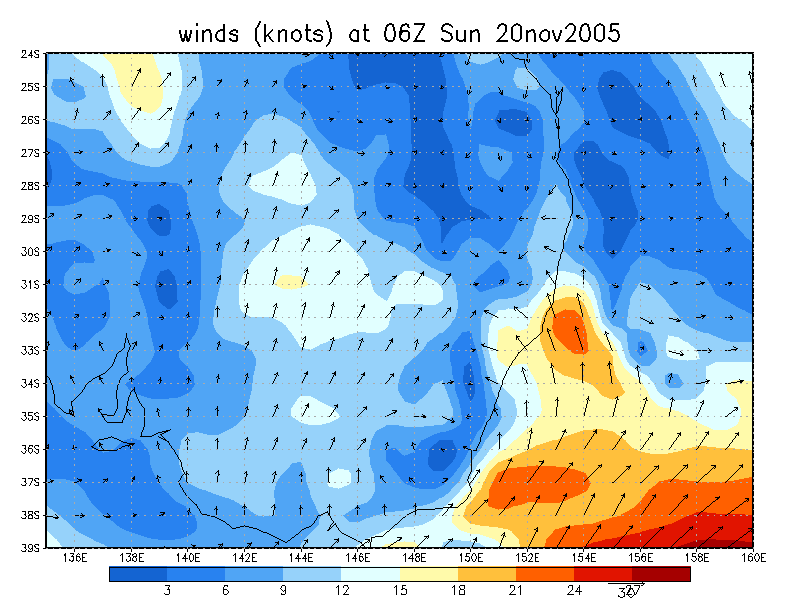
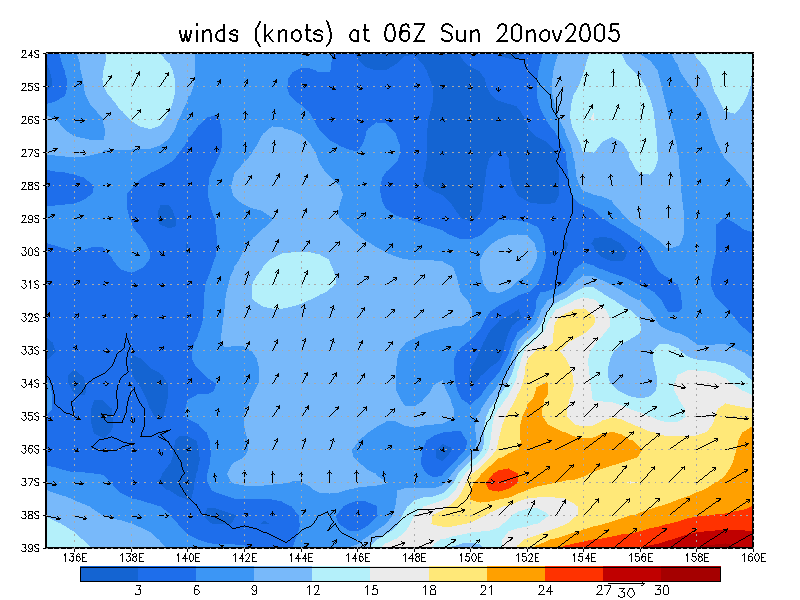
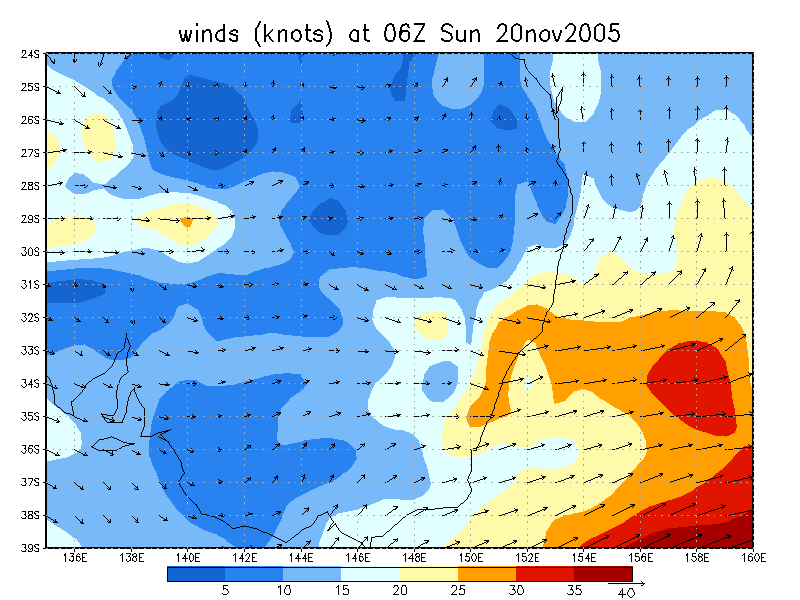
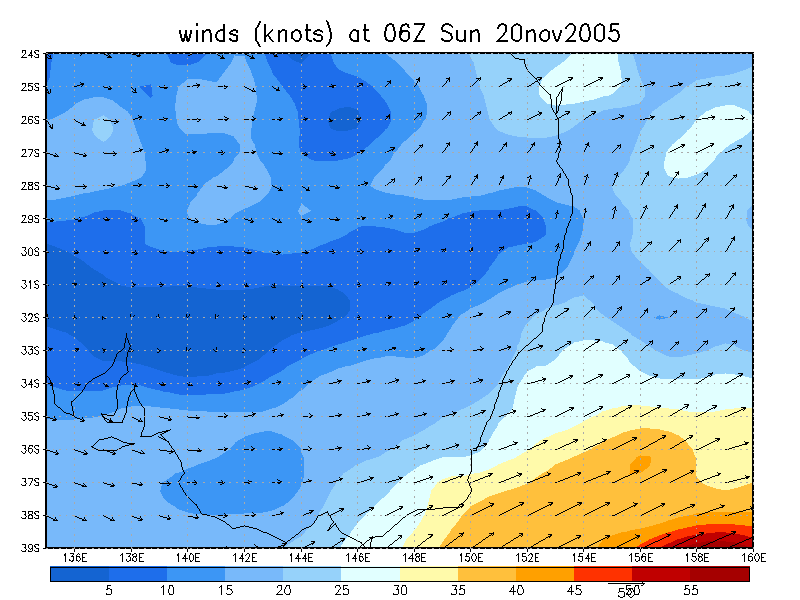
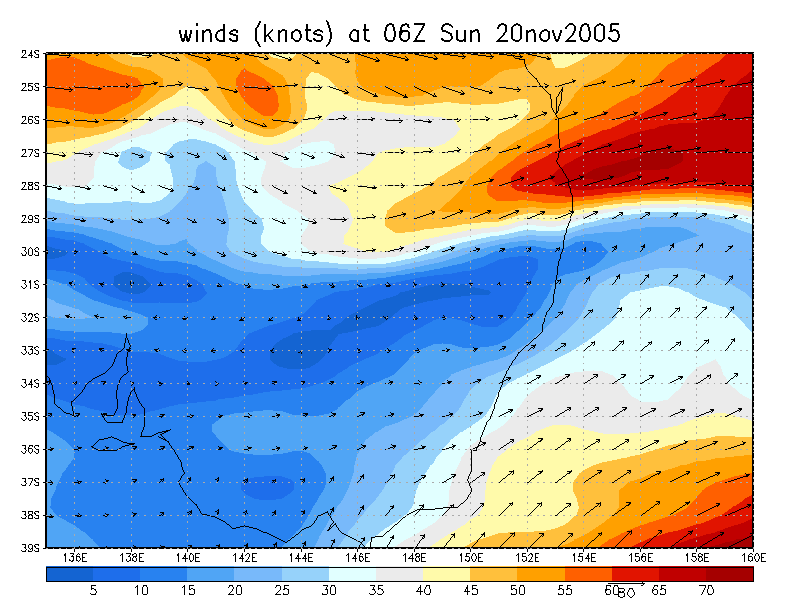
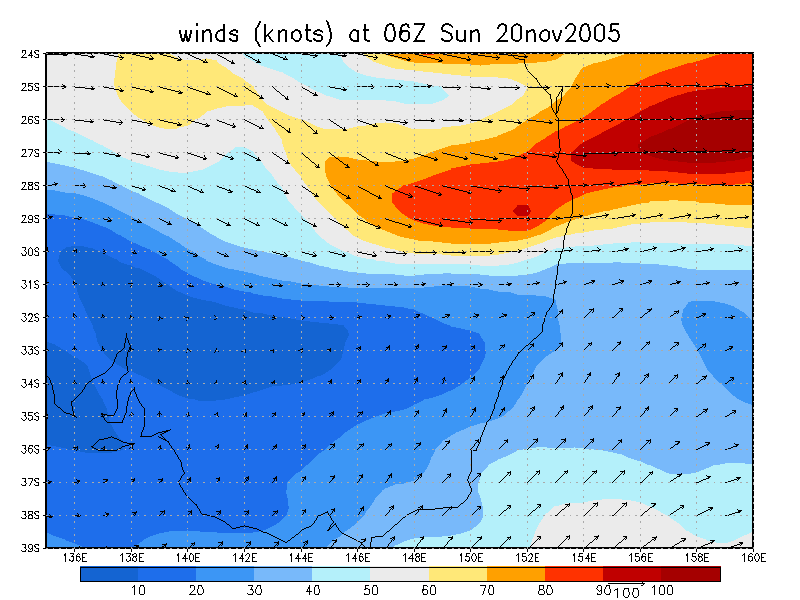
From NOAA 20/11/2005 06z analysis
|
Document: 200511-05.htm Updated: 13th January 2006 |
[Australian Severe Weather index] [Copyright Notice] [Email Contacts] [Search This Site] |