and Chasing
[Index][Archives]
Northern Rivers Storm Chase with Evening Lightning Show: Tuesday 13th December 2005
Report compiled by Michael Bath
| Storm News and Chasing [Index][Archives] |
Northern Rivers Storm Chase with Evening Lightning Show: Tuesday 13th December 2005 Report compiled by Michael Bath |
The first activity on radar was not till about 1pm. A stronger cell kicked off near Tabulam about 2pm. Given storms would move NE today this storm was not chaseable - and of course went on to become a supercell as it crossed the border into SE Queensland.
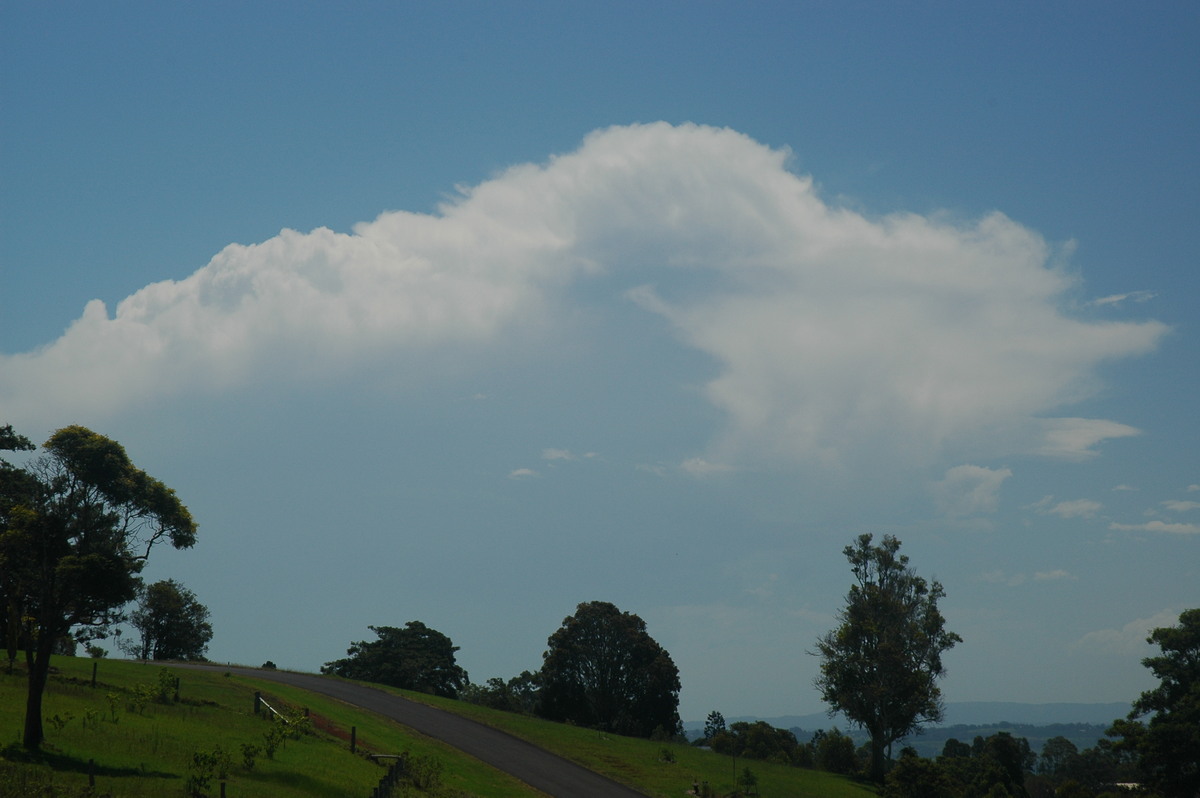
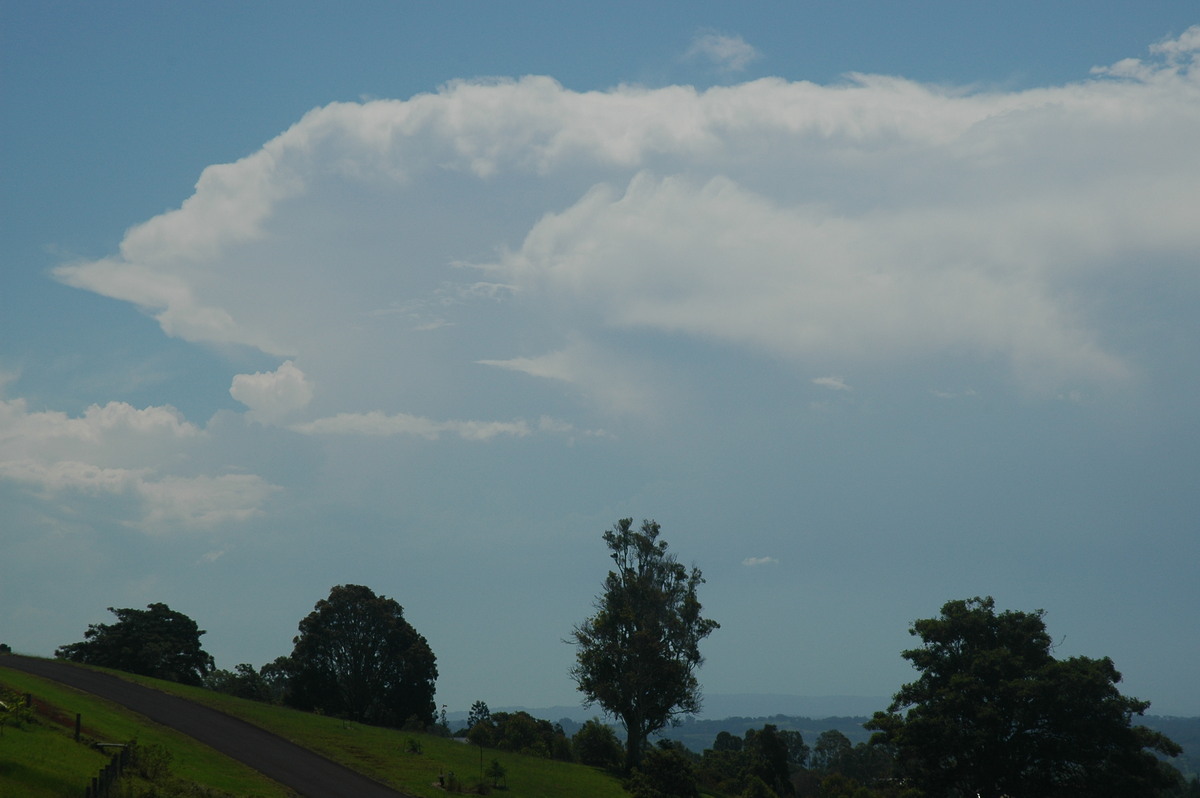
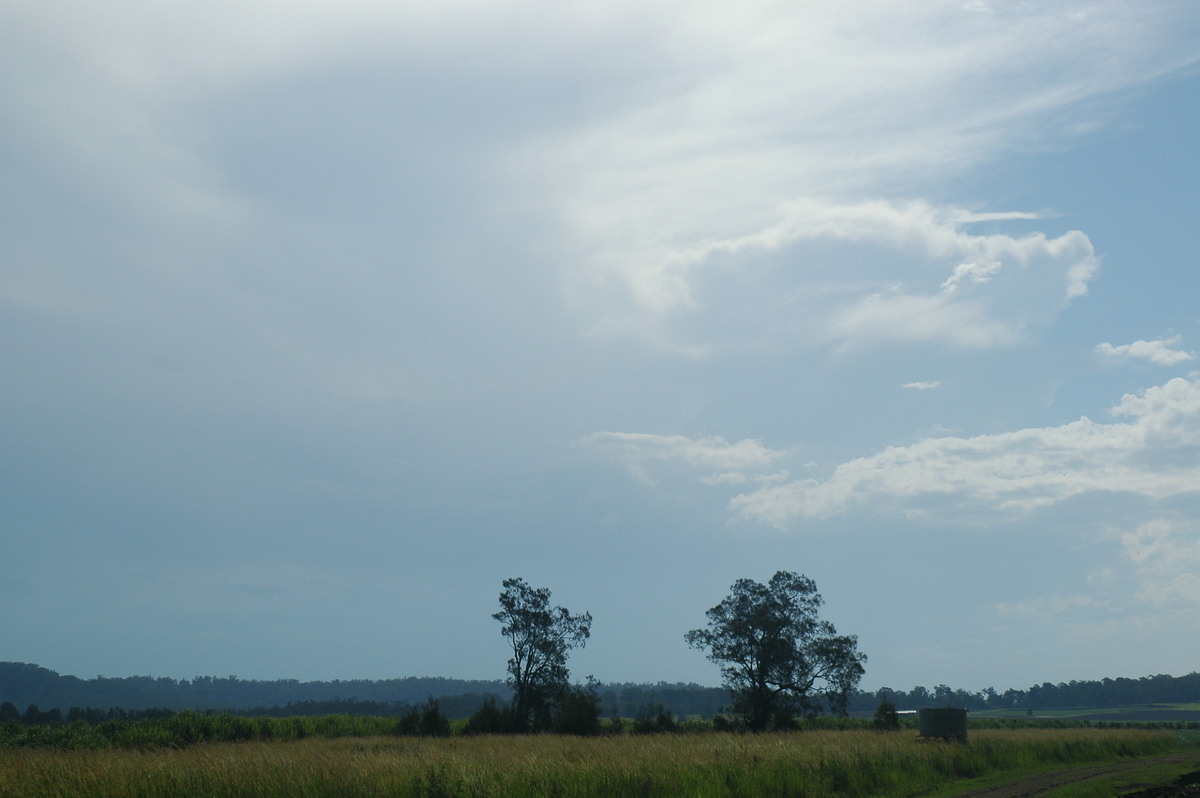
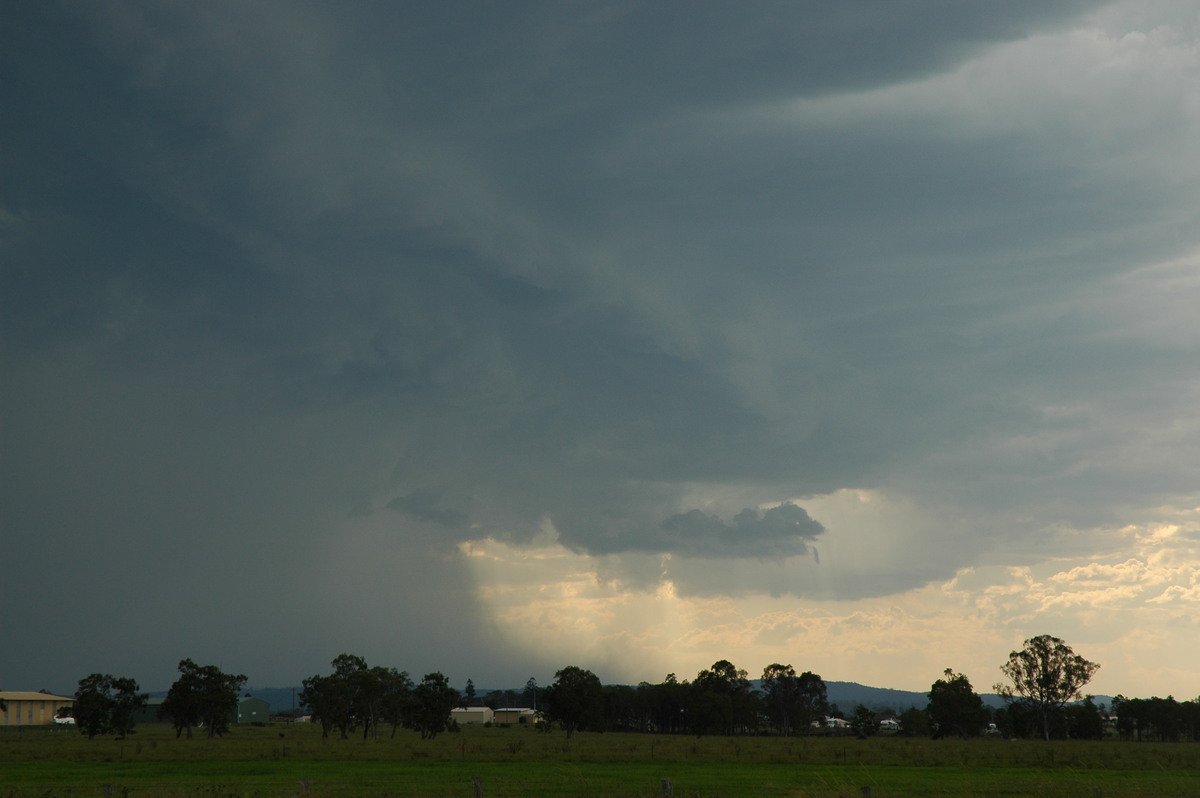
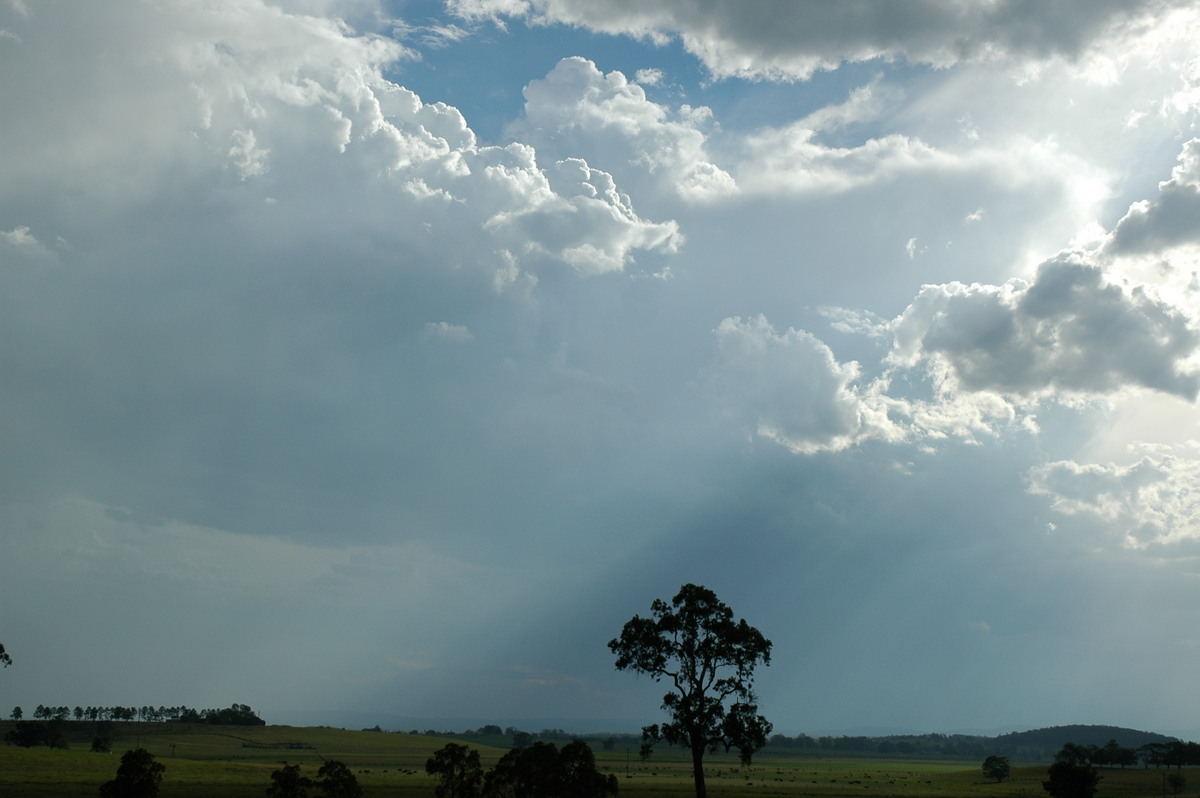
Dave Ellem and I headed out about 3pm, initially expecting more storms to form just to the south of the Northern Rivers and head into usual chase territory. At the first vantage point all activity seemed high based and low topped. An exception was the storm heading into Queensland which had a strong looking anvil. We could not see the base properly due to the haze.
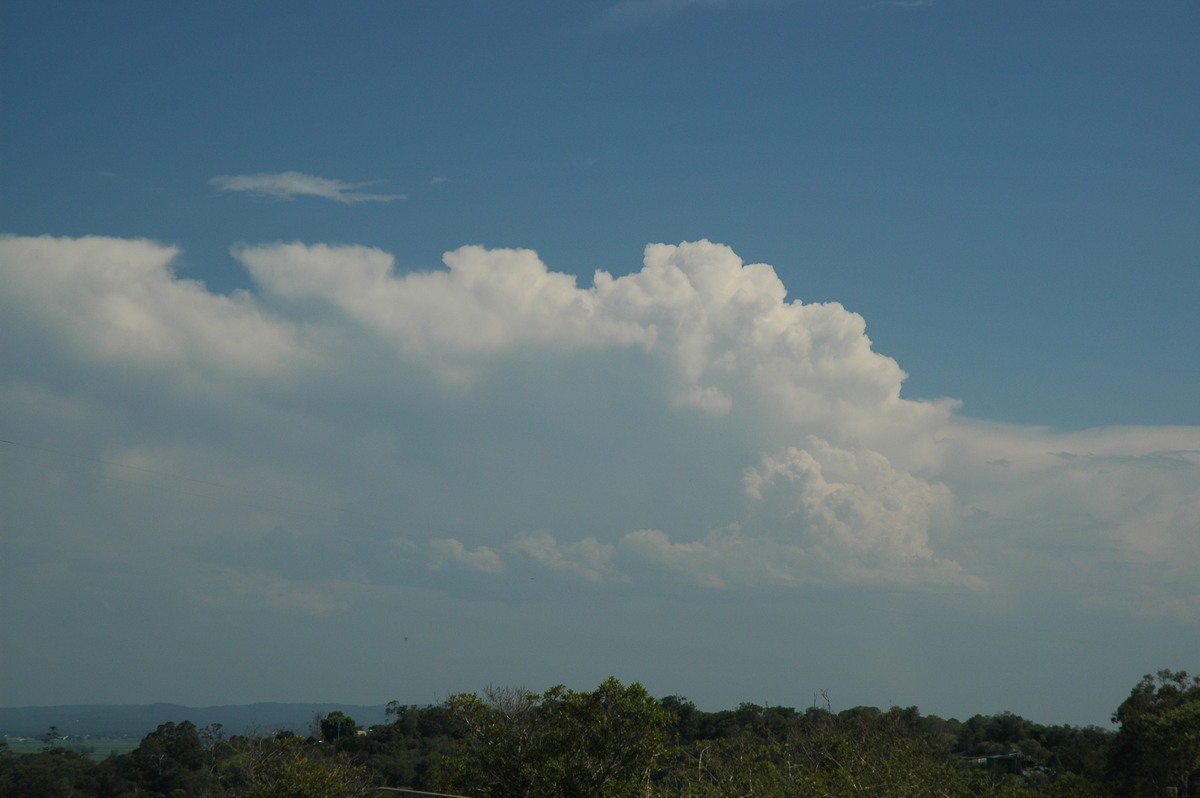
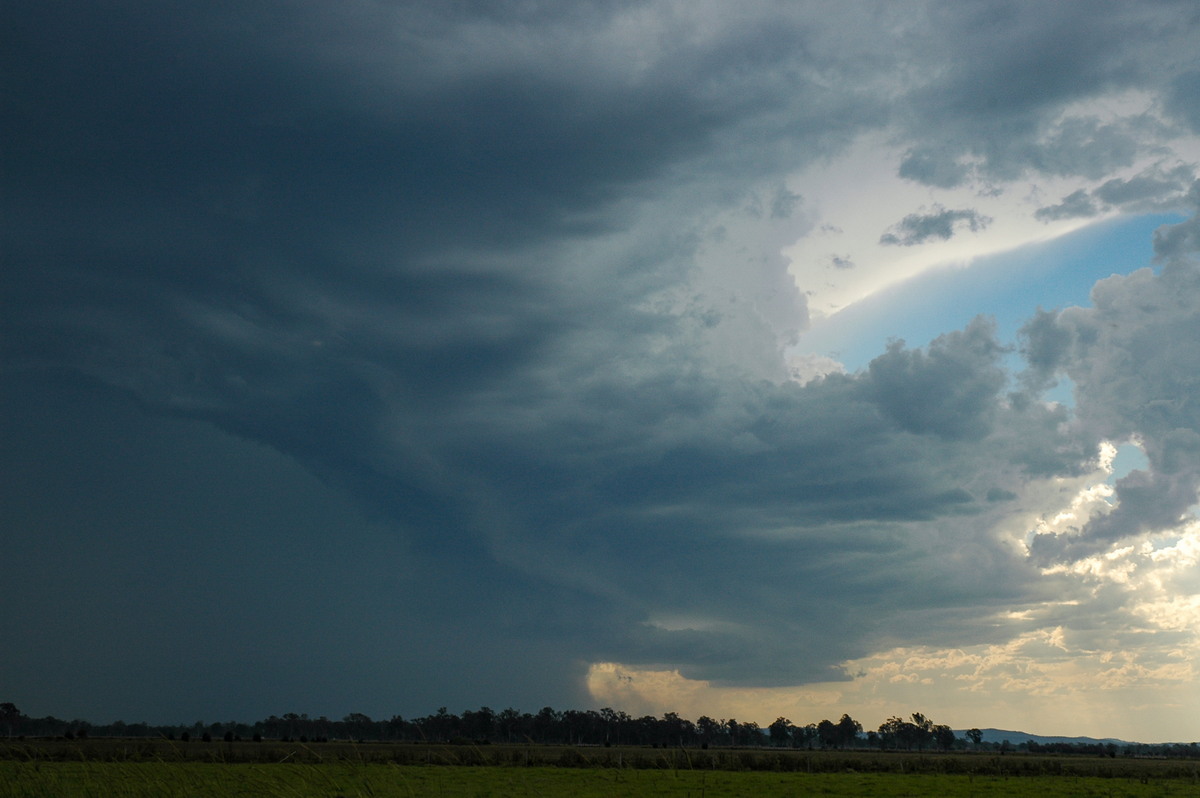
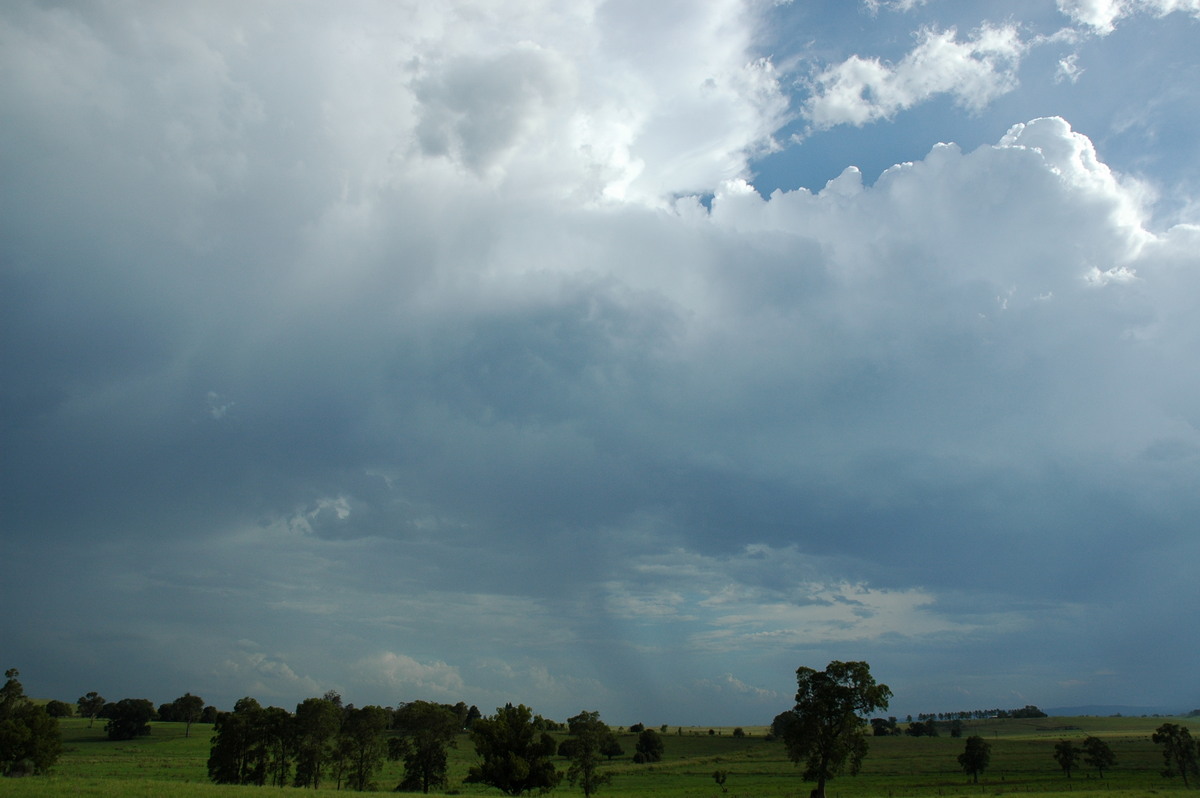
It was quite hot as we waited near Woodburn. Contrast was poor but fresh updrafts on a messy looking storm slowly came into view to our southwest. Once it started to really kick off, we shot NW along the Coraki Casino road.
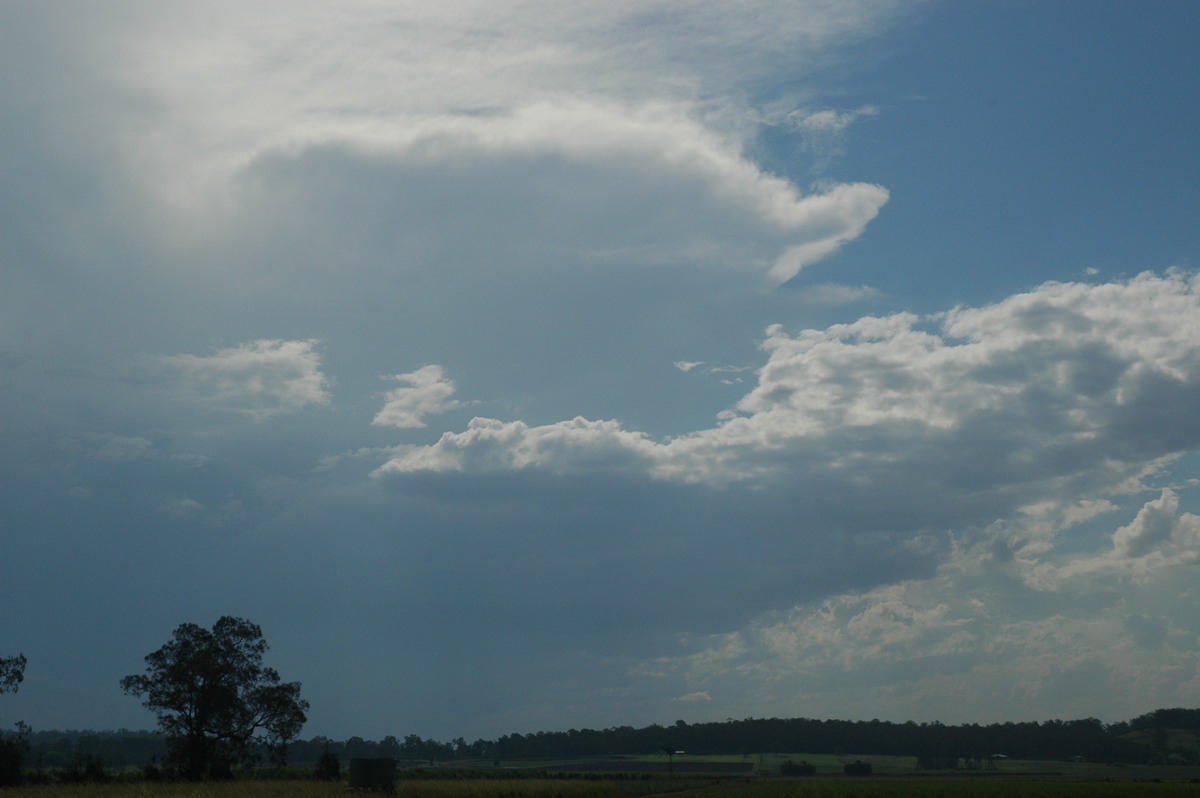
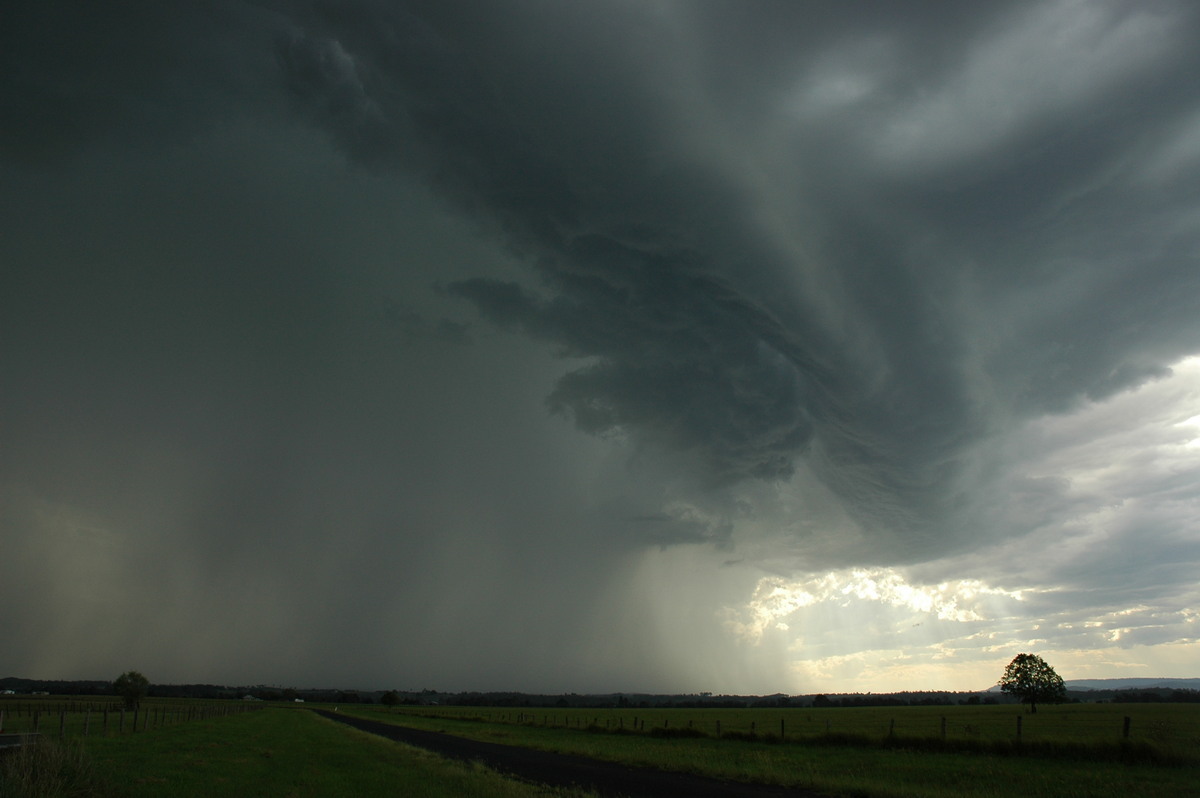
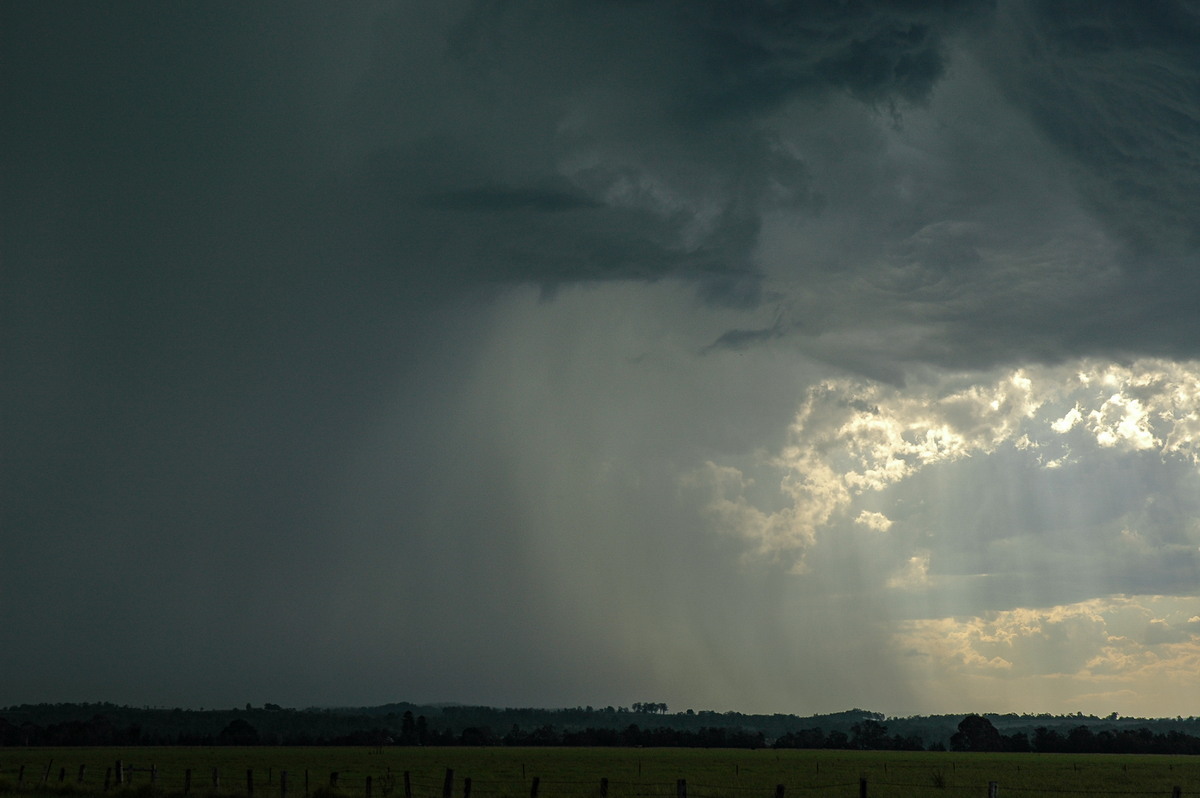
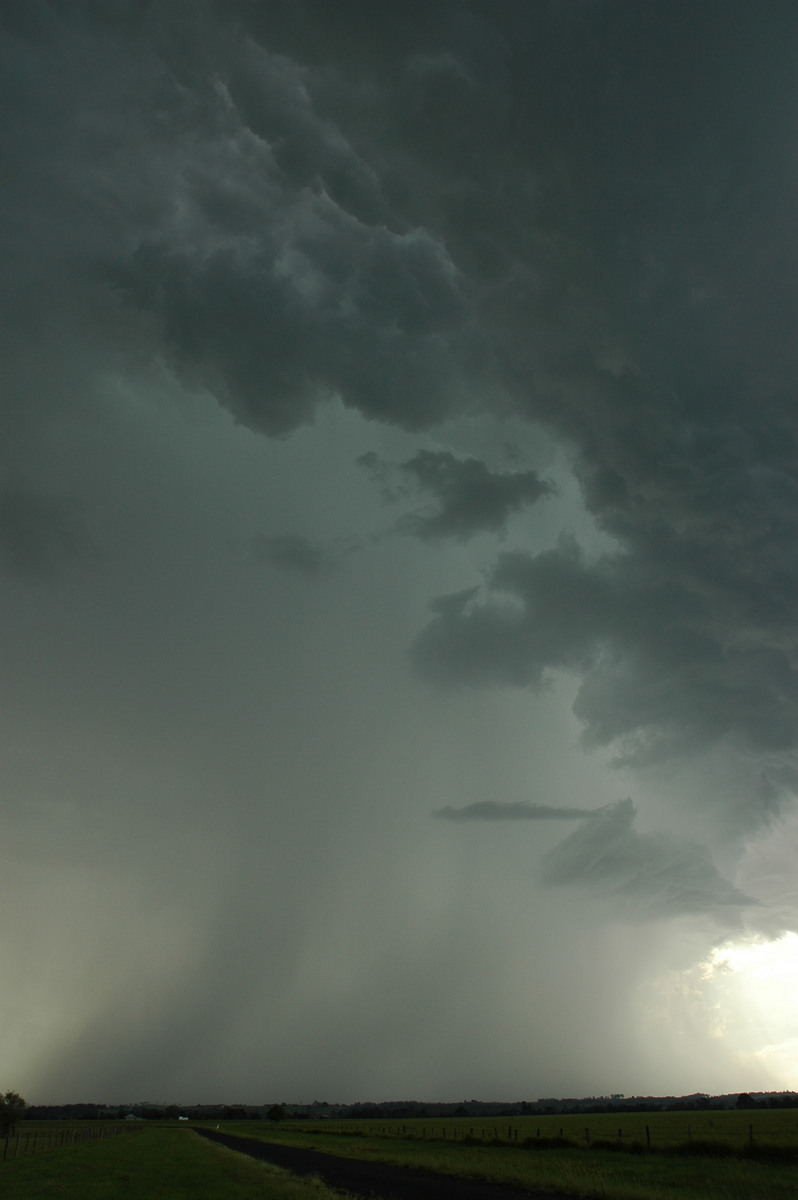
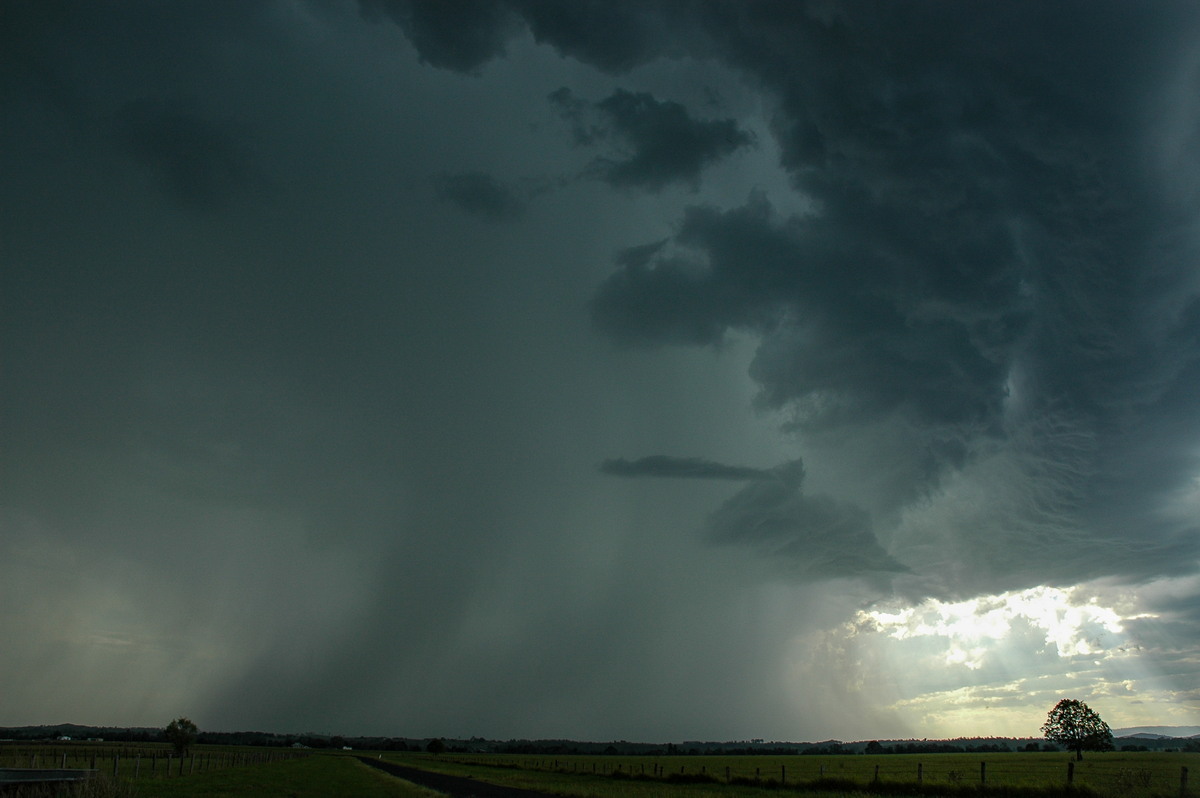
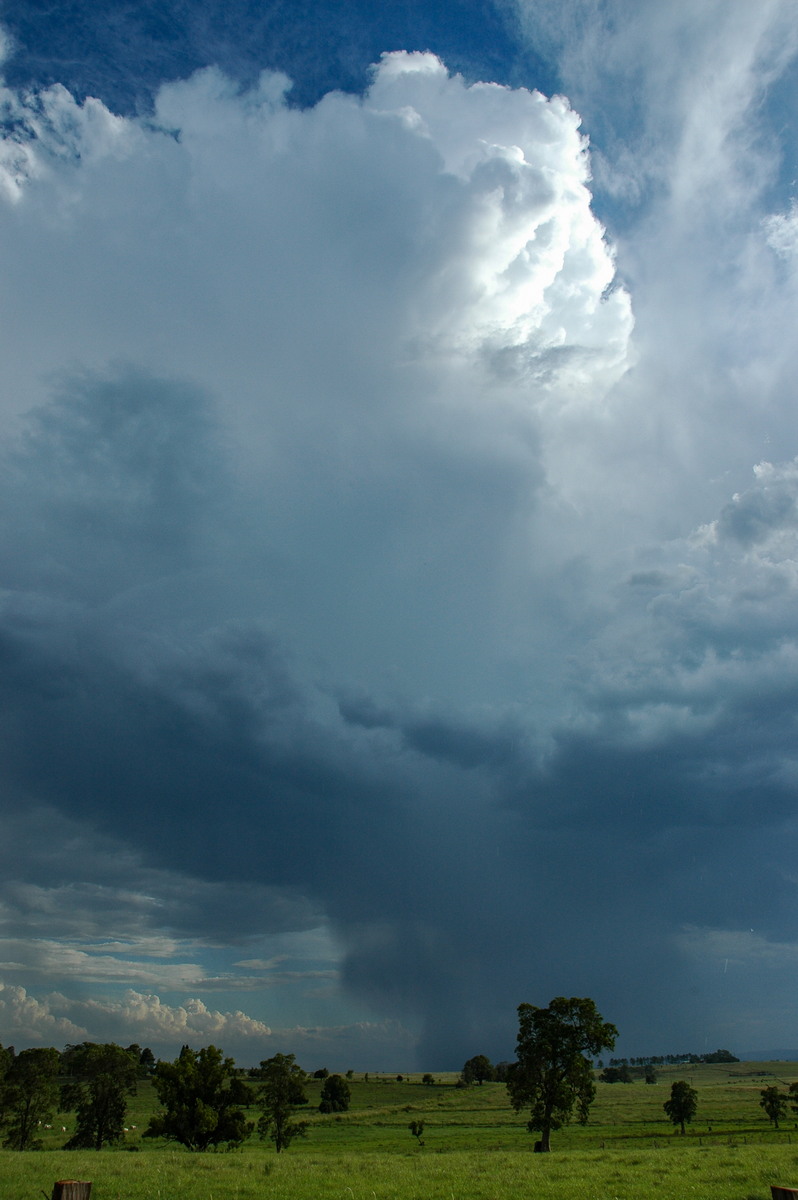
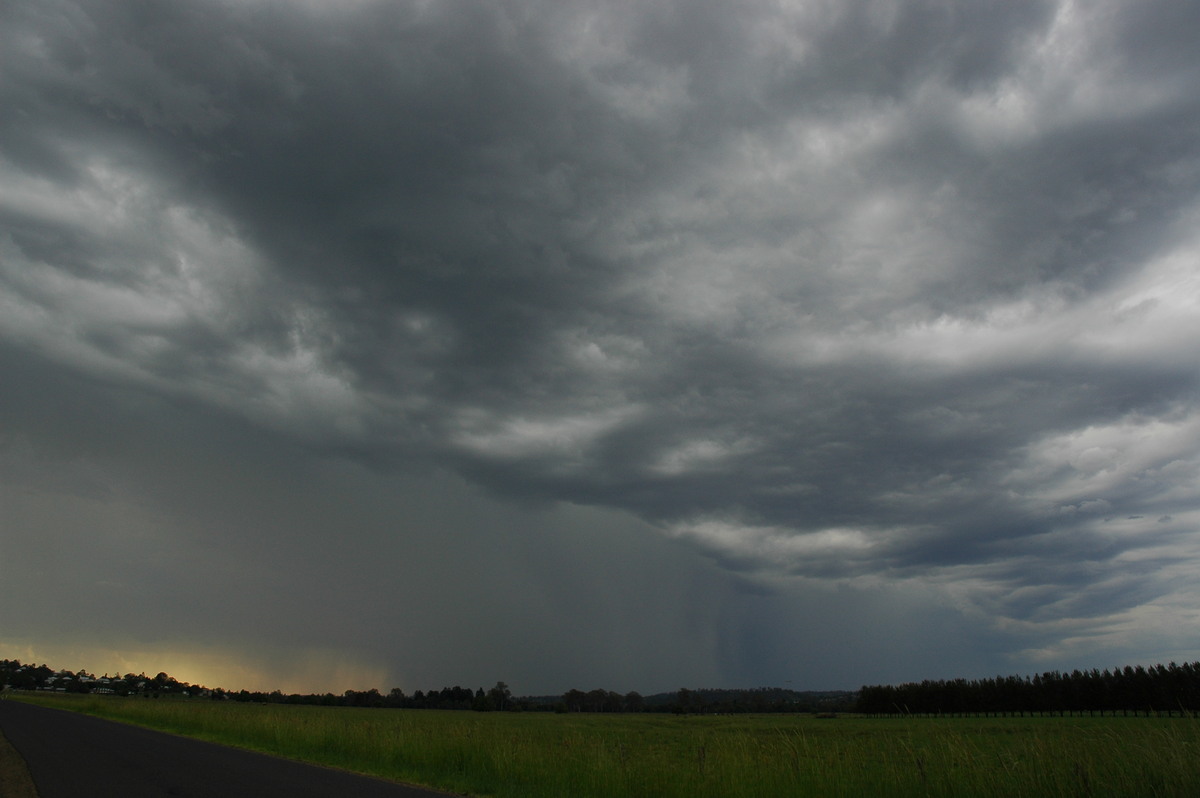
The closer view revealed very strong updrafts and a thick curved anvil spreading eastward. There was great updraft-downdraft separation and microbursts on the northern edge.
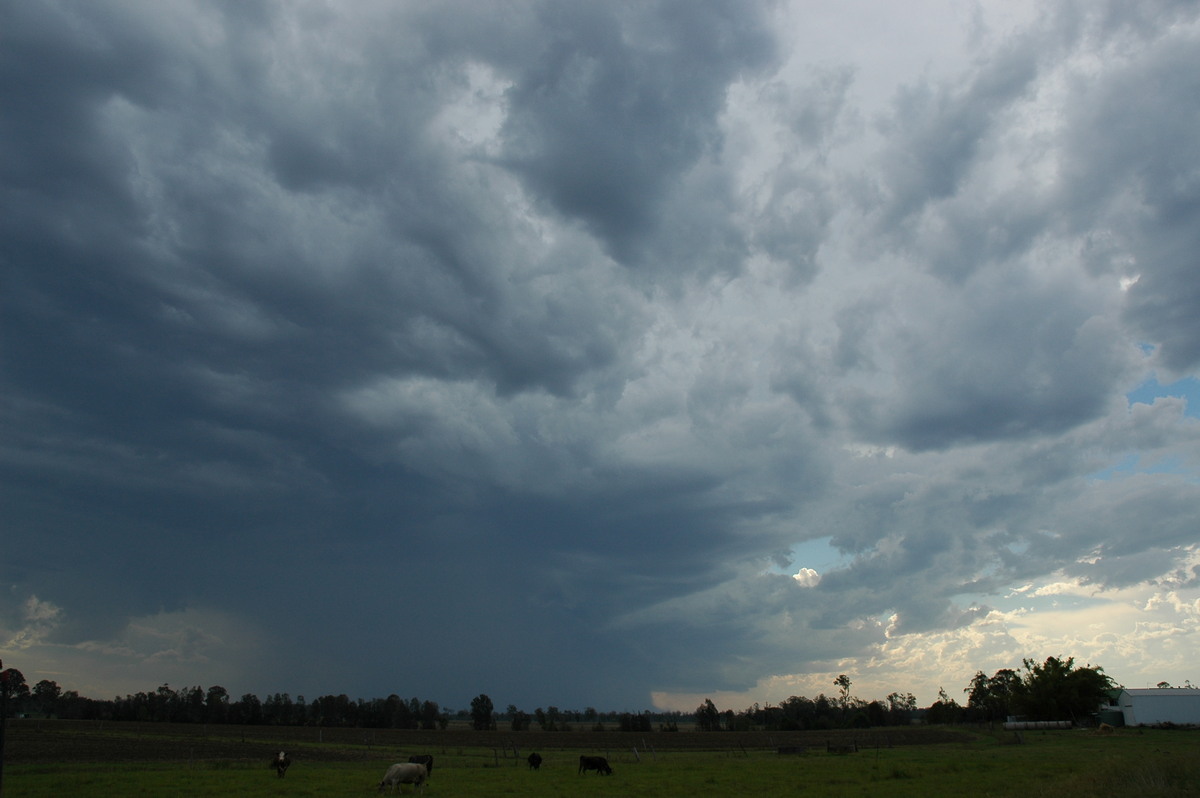
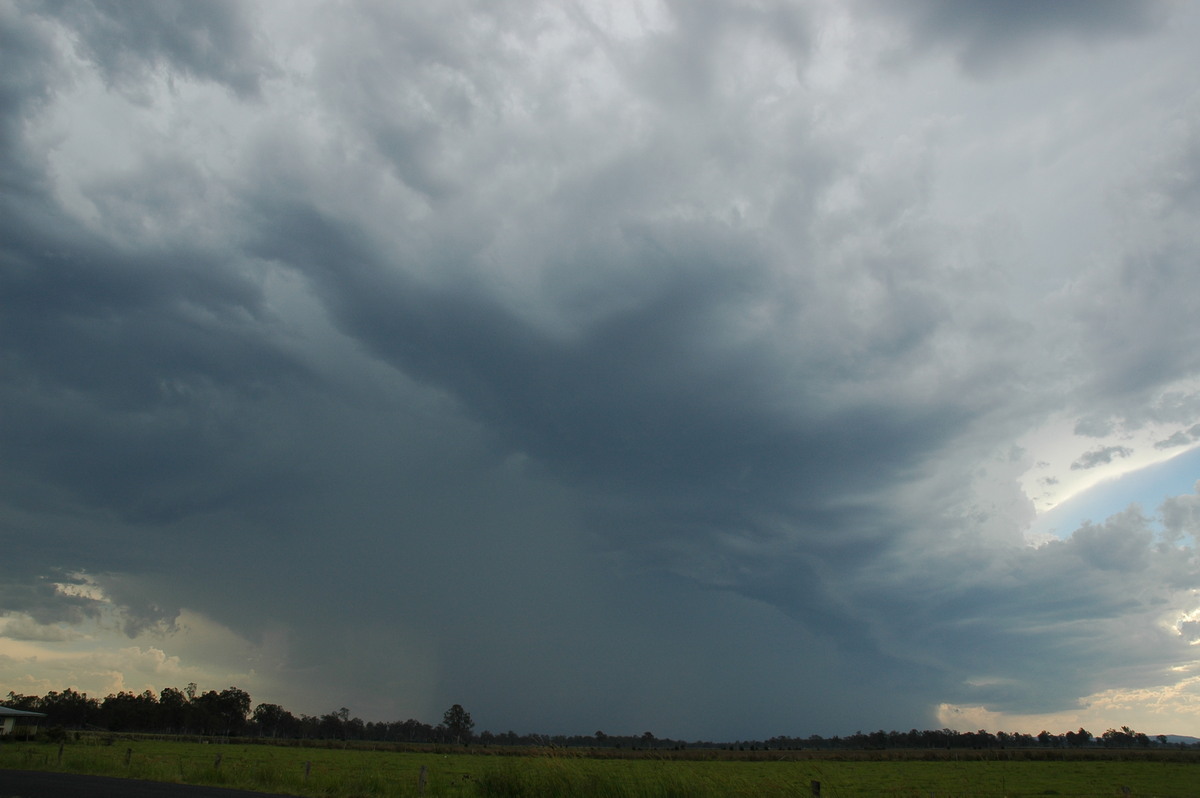
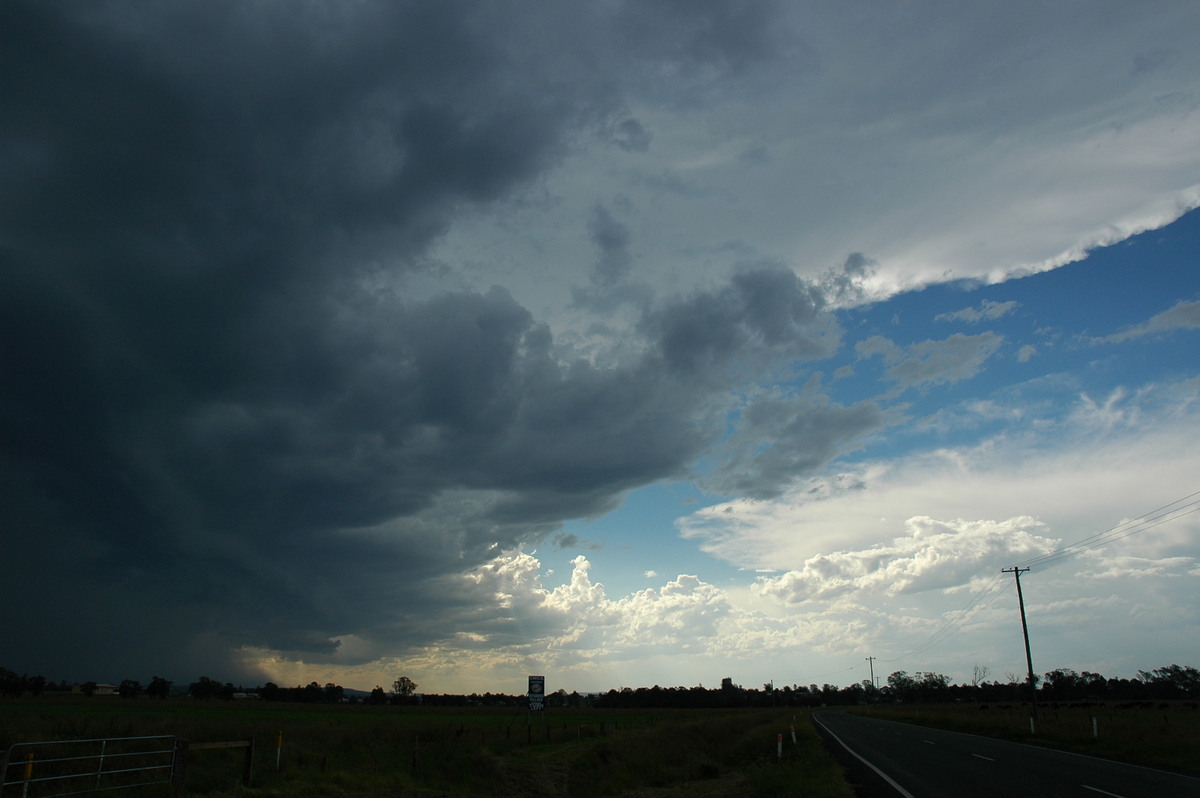
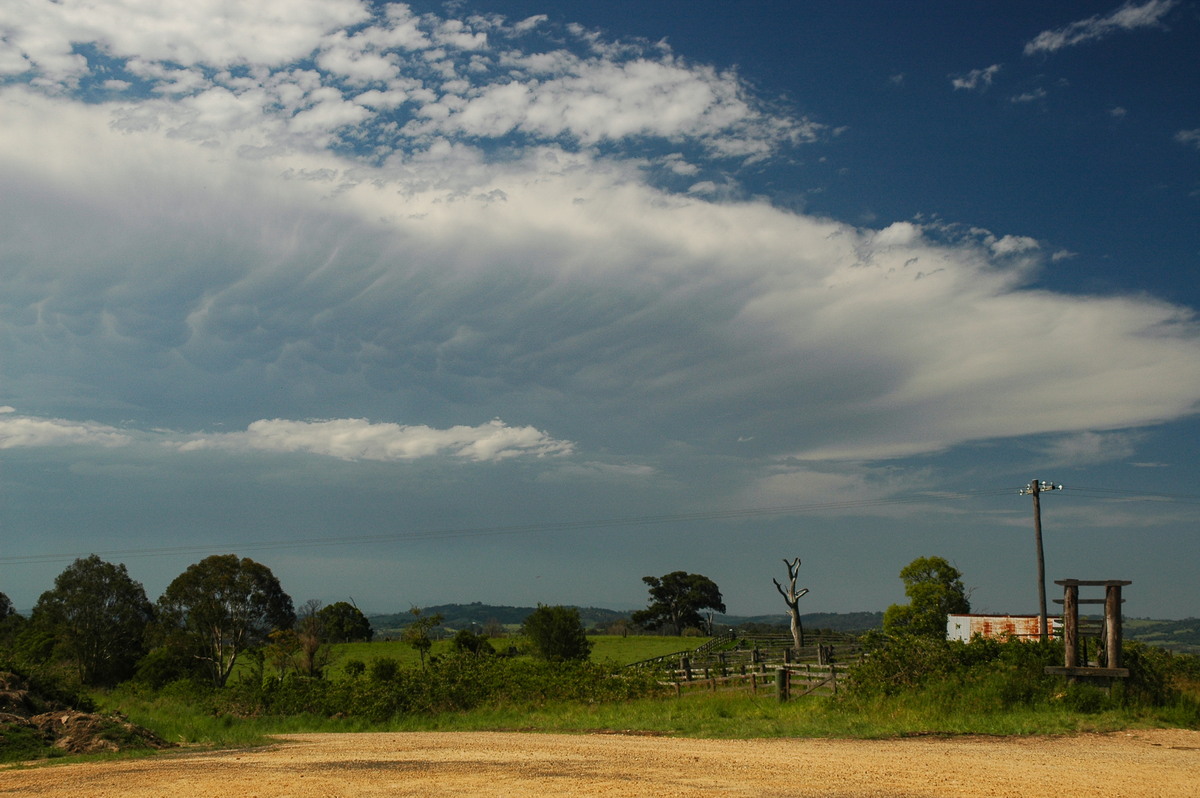
CG lightning was now observed and a shelf cloud like structure developed along the NE base inflow region.
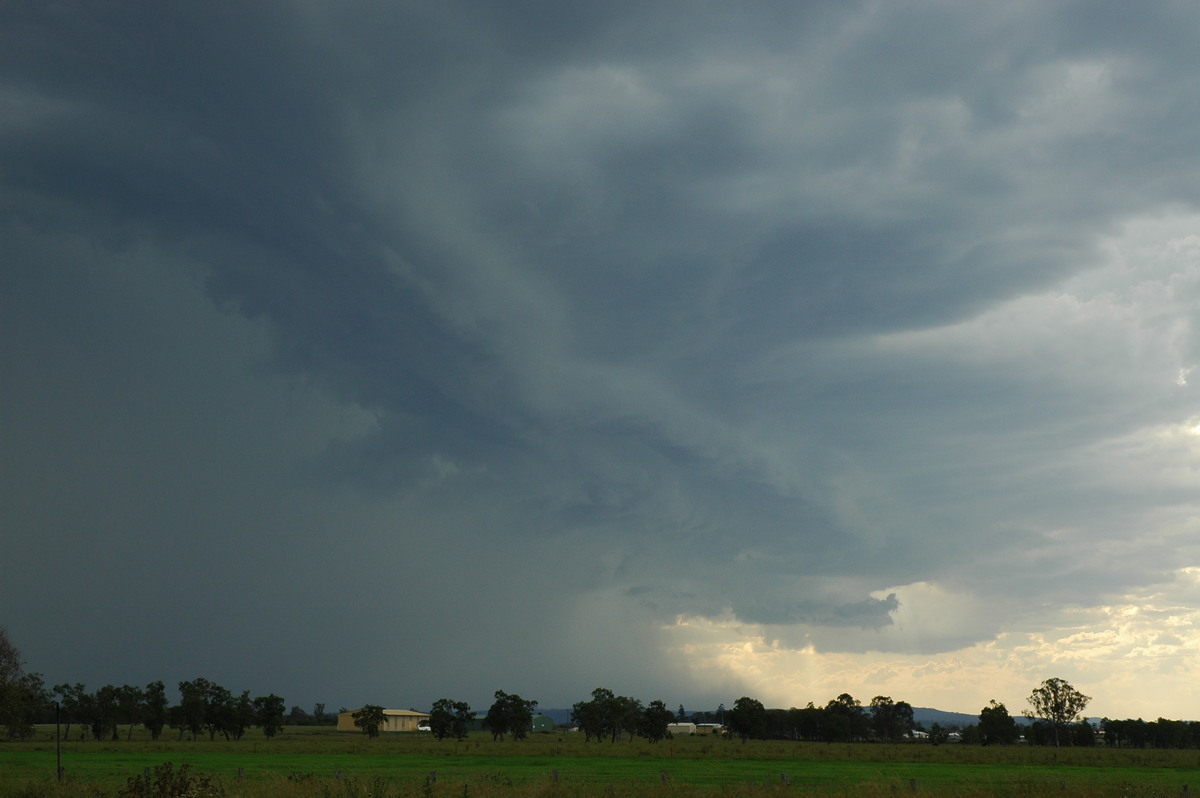
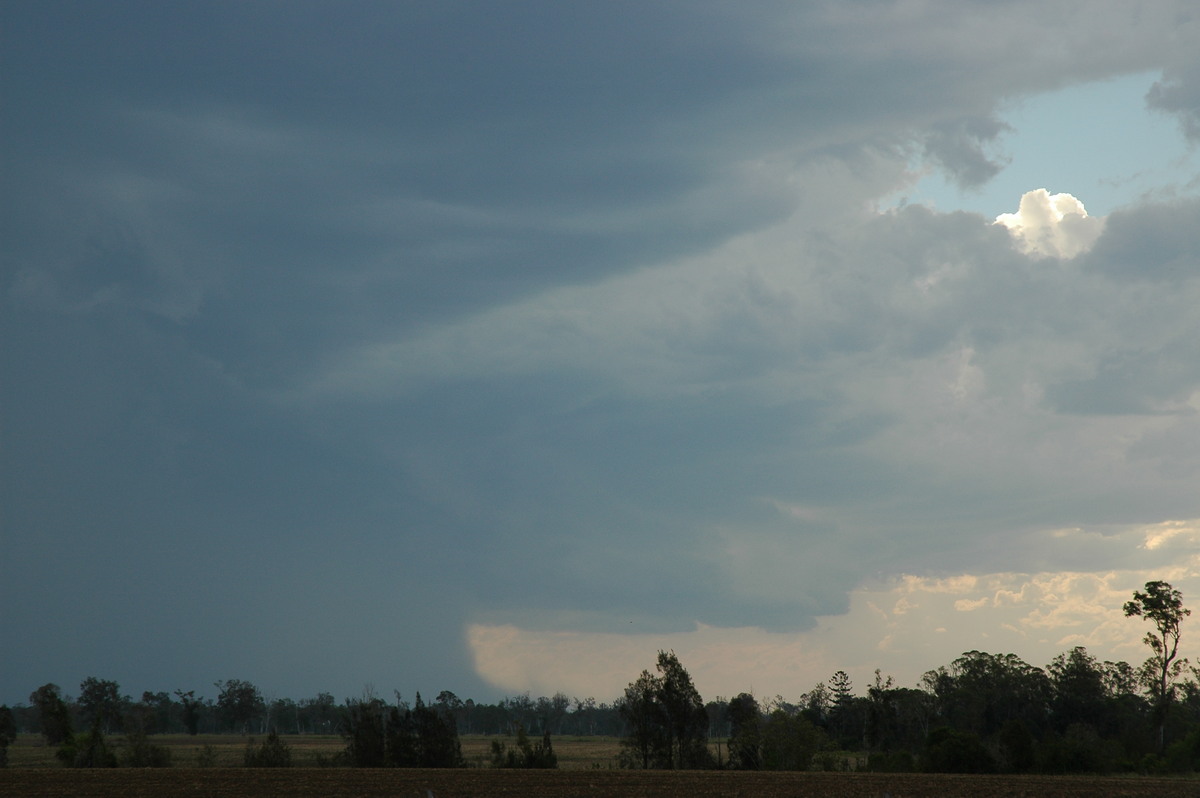
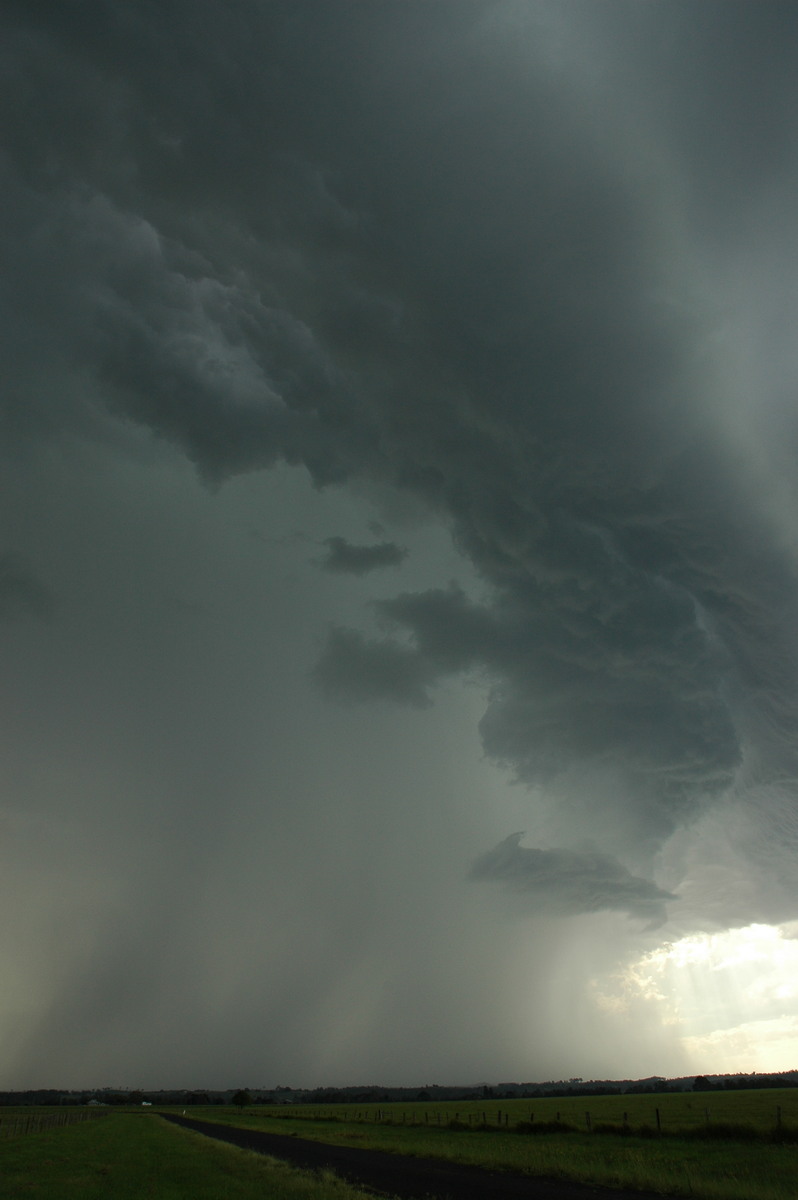
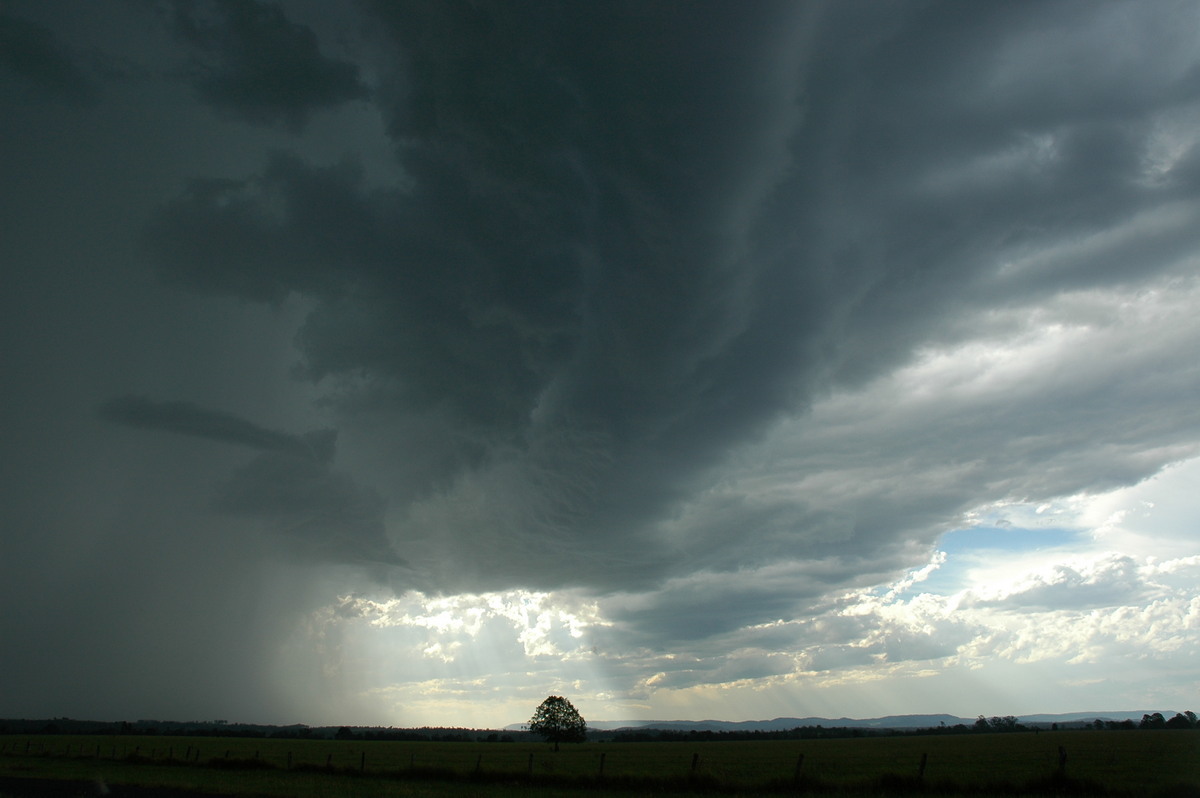
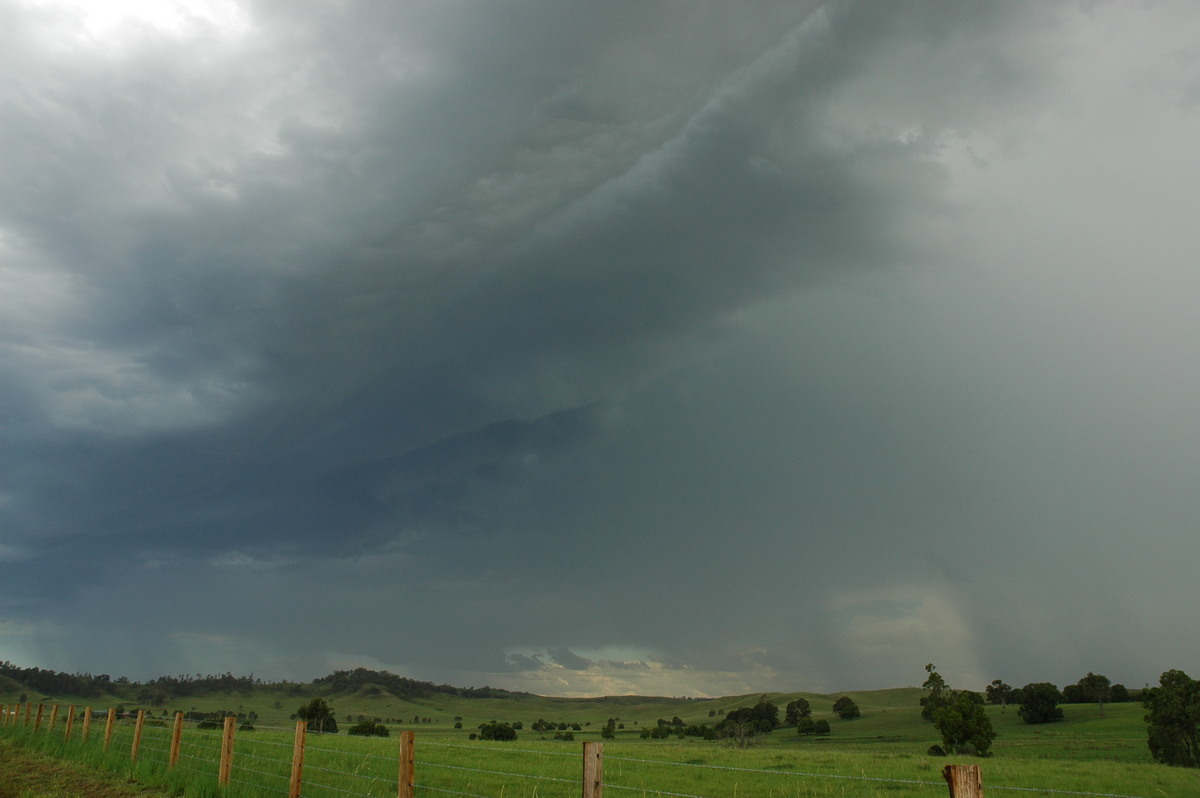
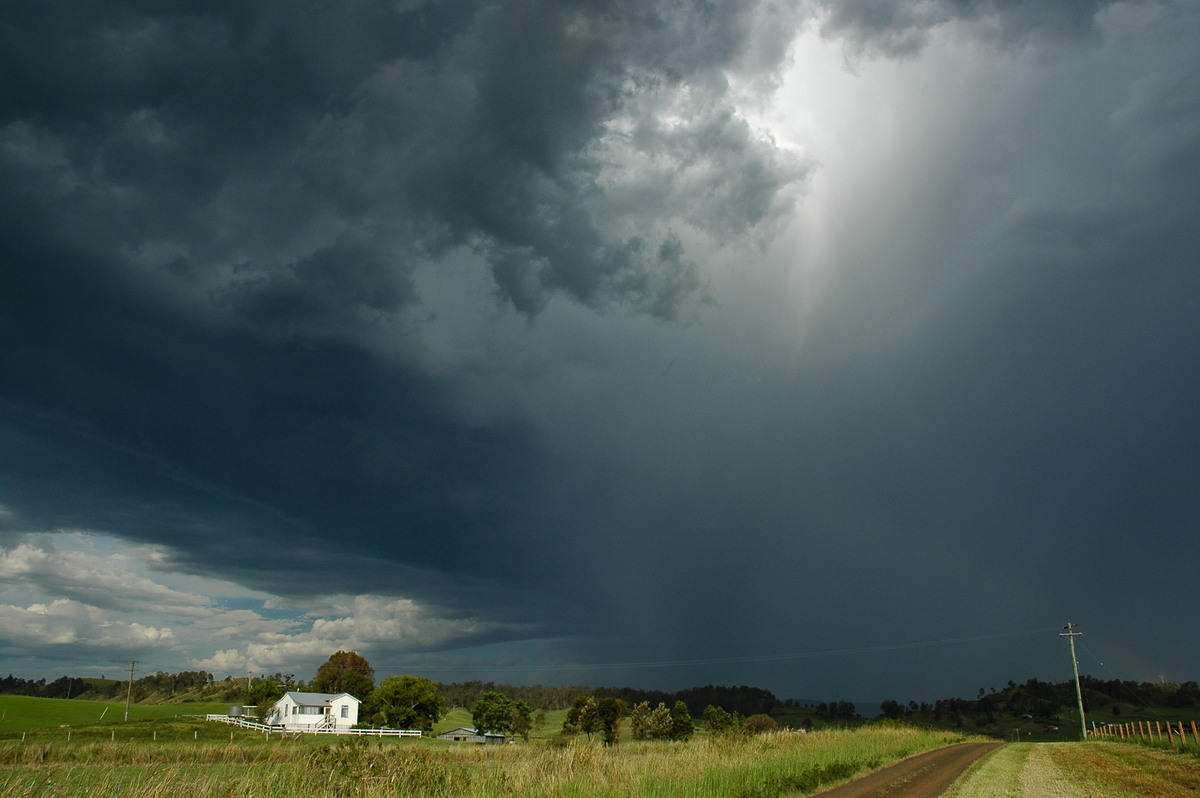
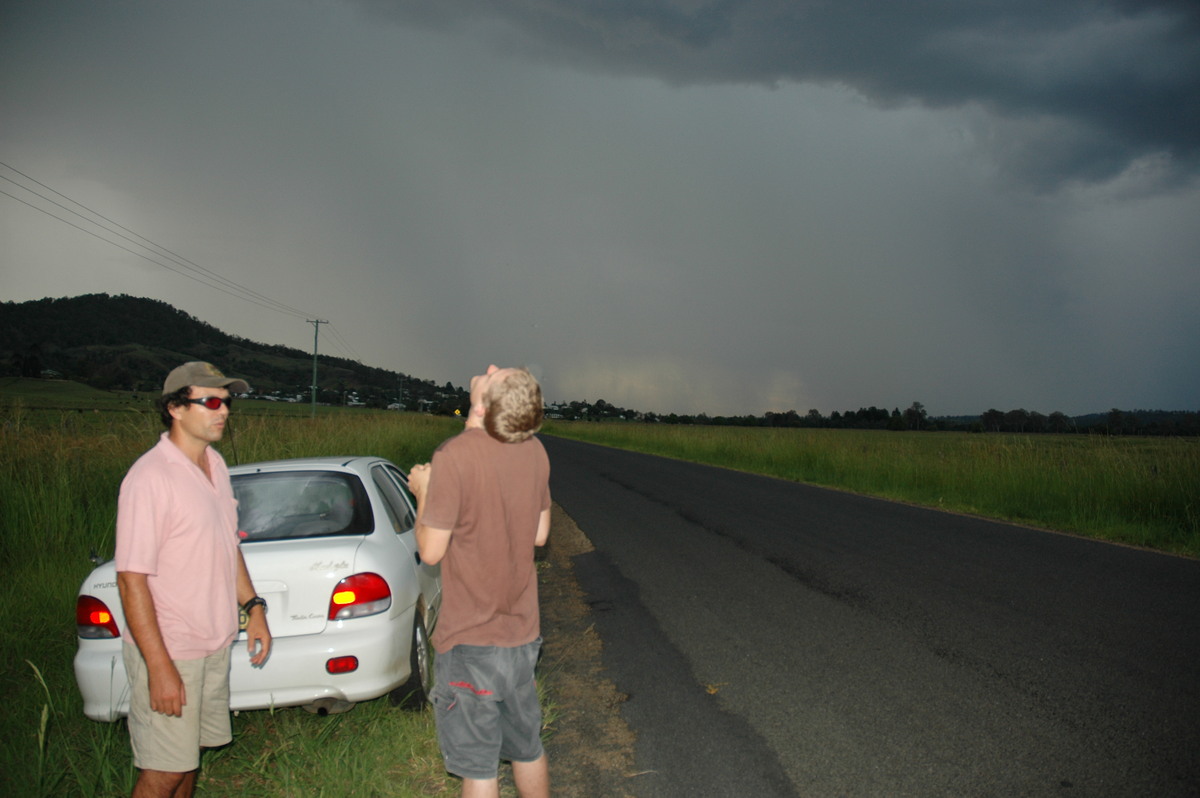
The drive through Casino was slow and frustrating and by the time we got to a good location NW of town, the cell had weakened a little and lost its earlier very organised appearance. However, the CG lightning was full on and the turbulent inflow shelf cloud feature was amazing - especially as it was now overhead ! We couldn't stay there long so moved further north towards Kyogle. A line of precipitation spread eastward now and lightning occurred along this line and the original cell.
Just south of Kyogle we watched as the storms passed to our southeast and weakened further.
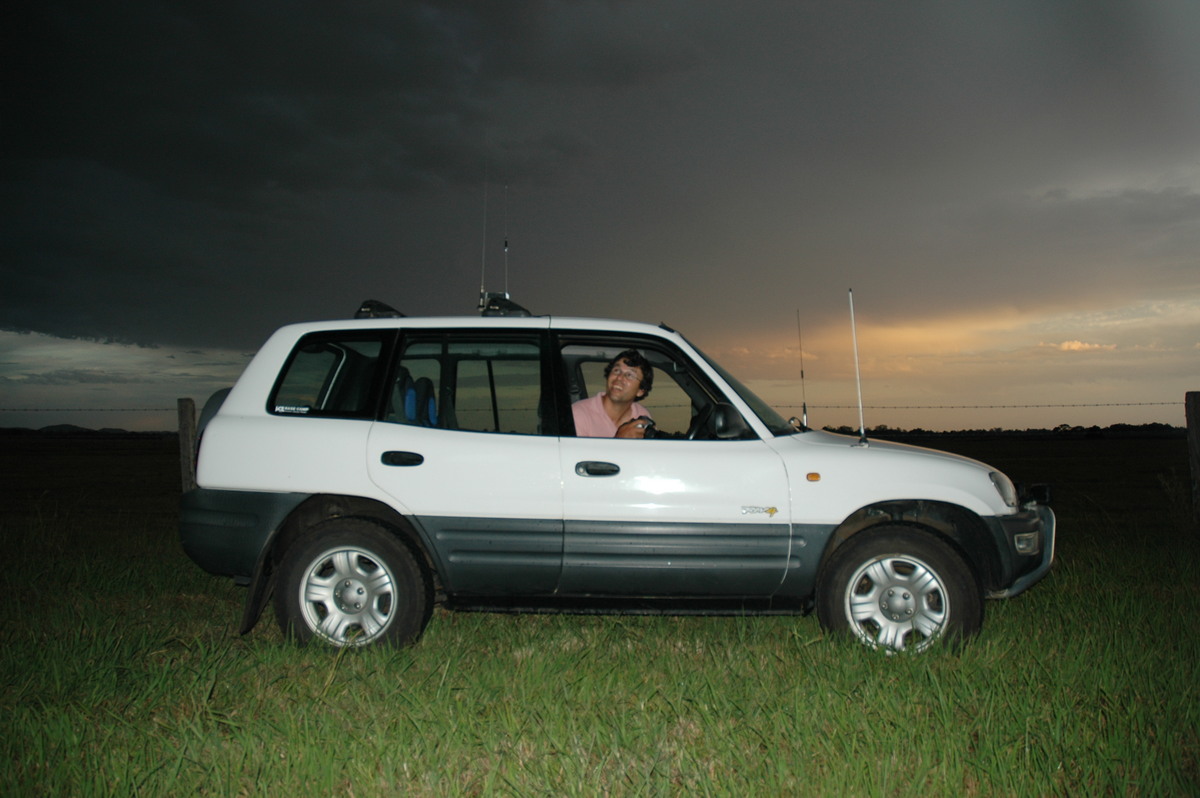
It was not over as more storms were forming to the southwest. We got some food at Kyogle then waited just north of town. Rodney Wallbridge met up with us just prior to a weak looking line of activity centred along the Richmond Range passing over. CG and anvil crawler lightning was occurring.
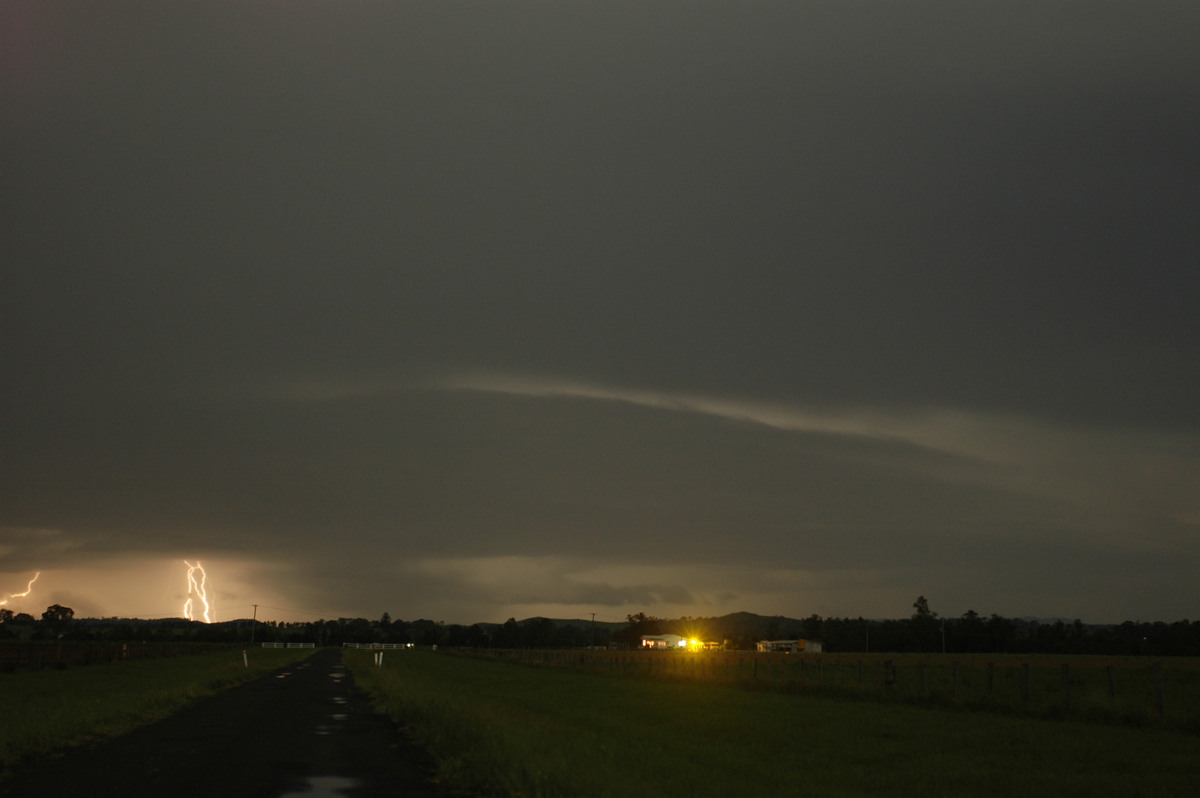
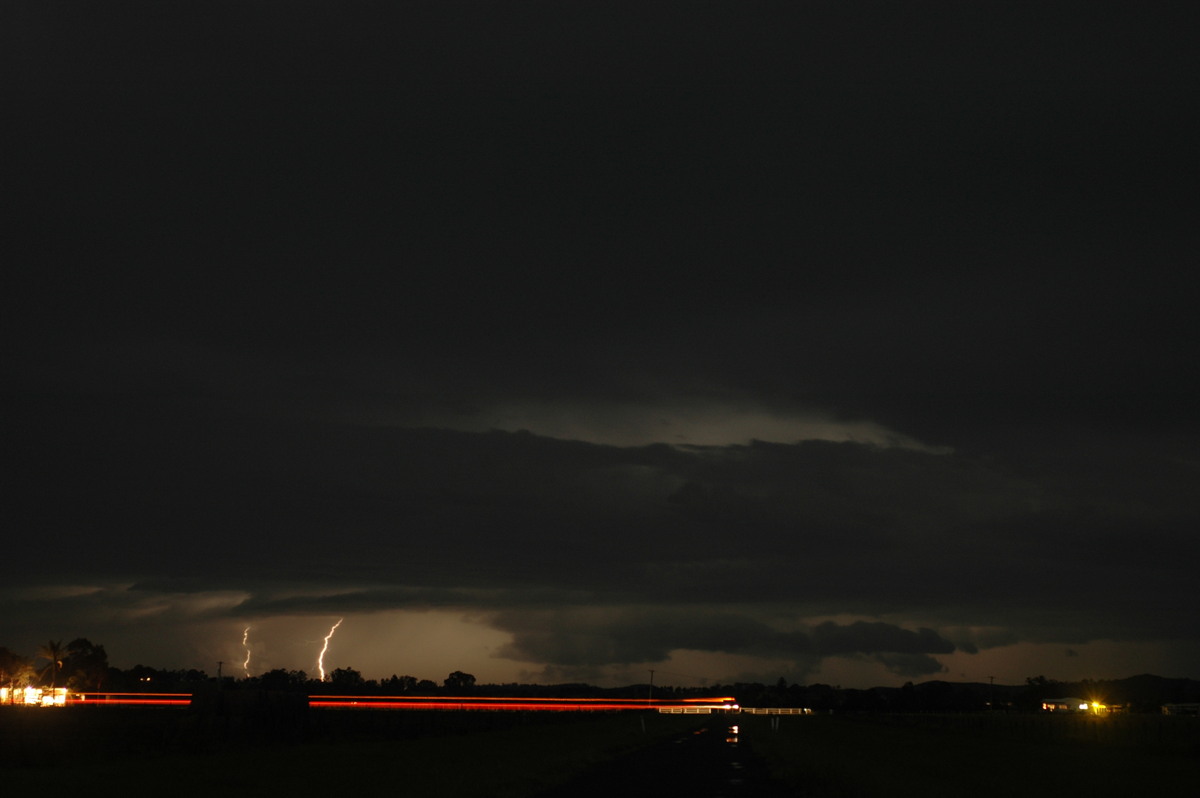
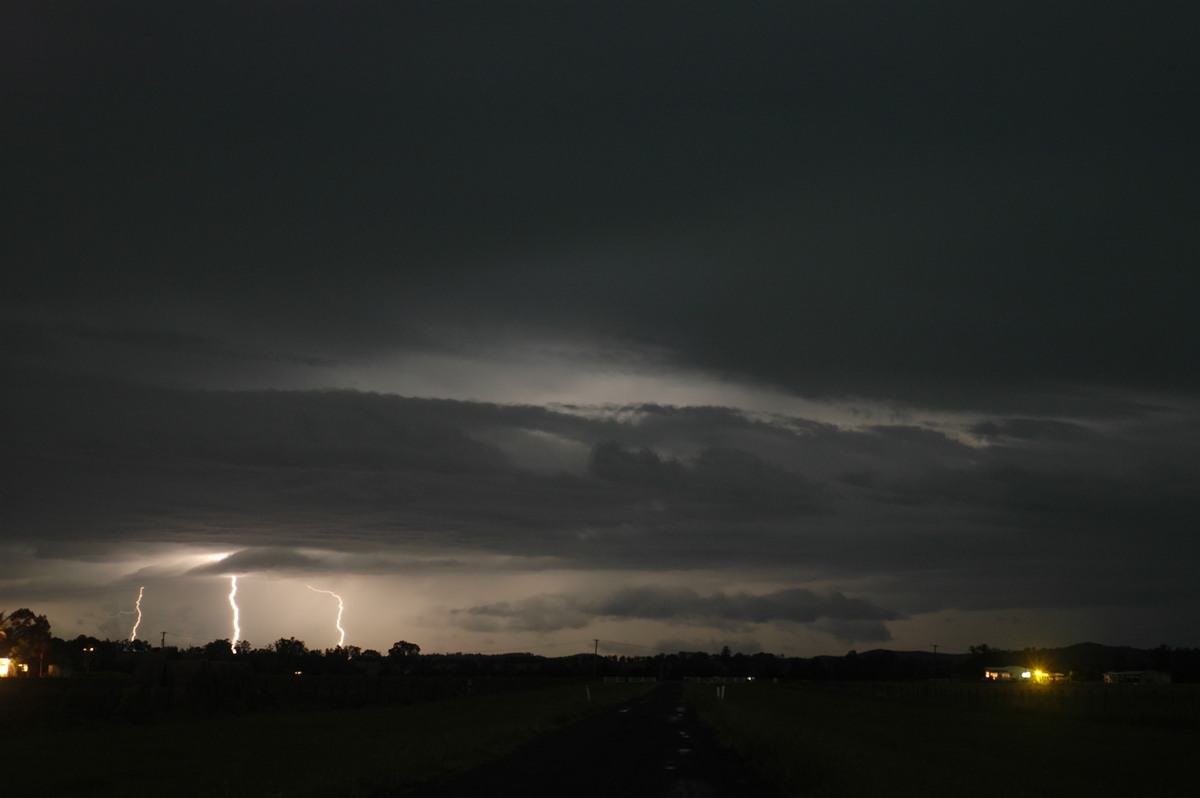
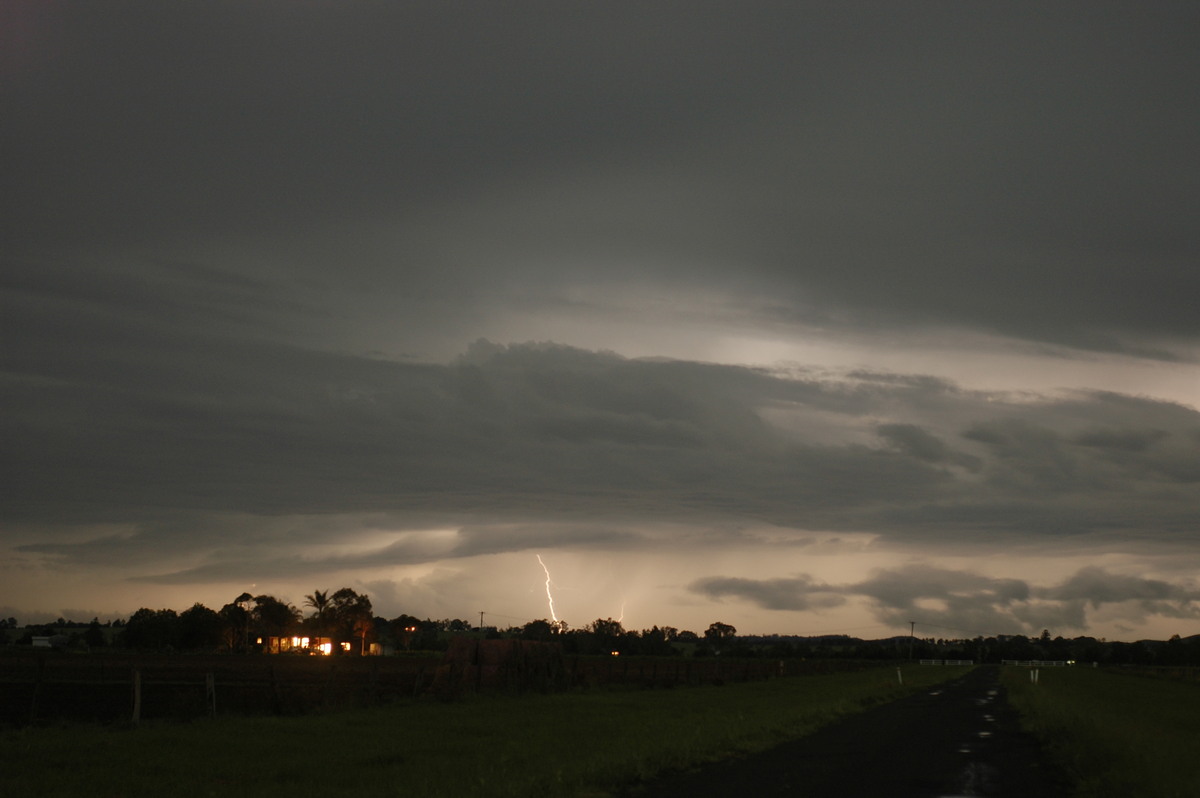
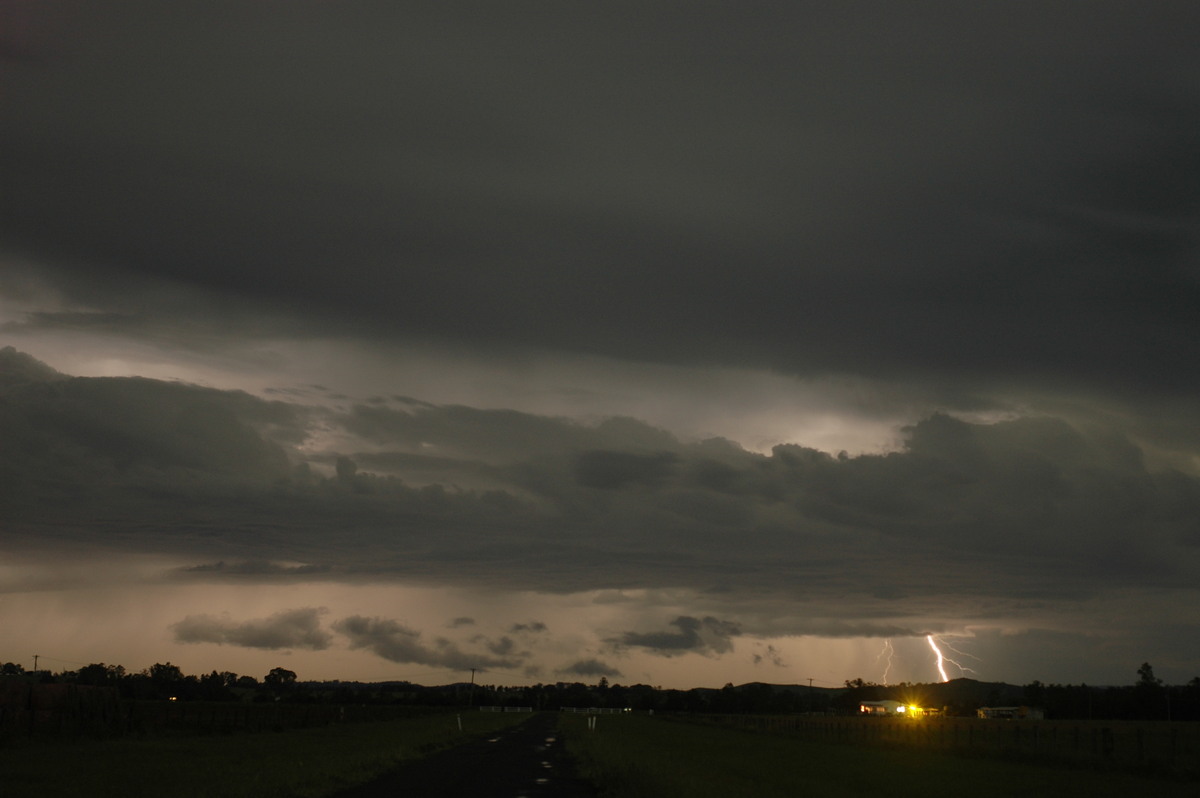
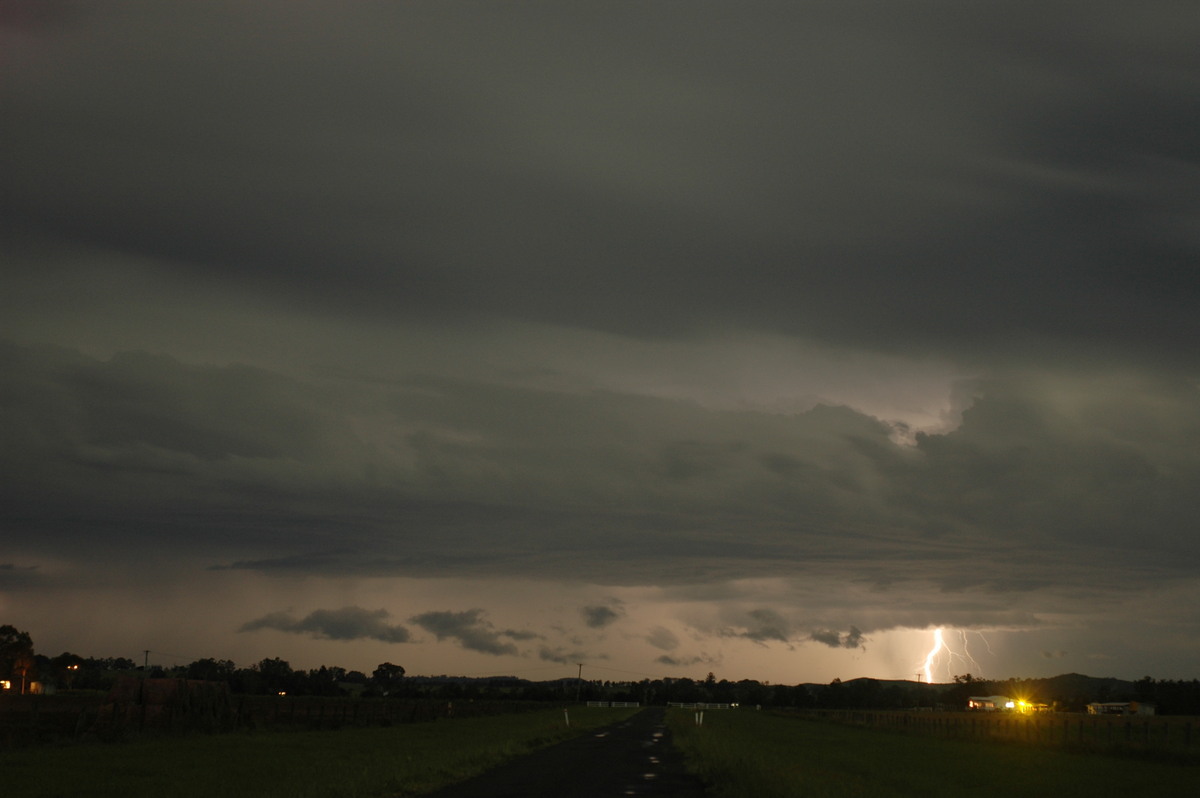
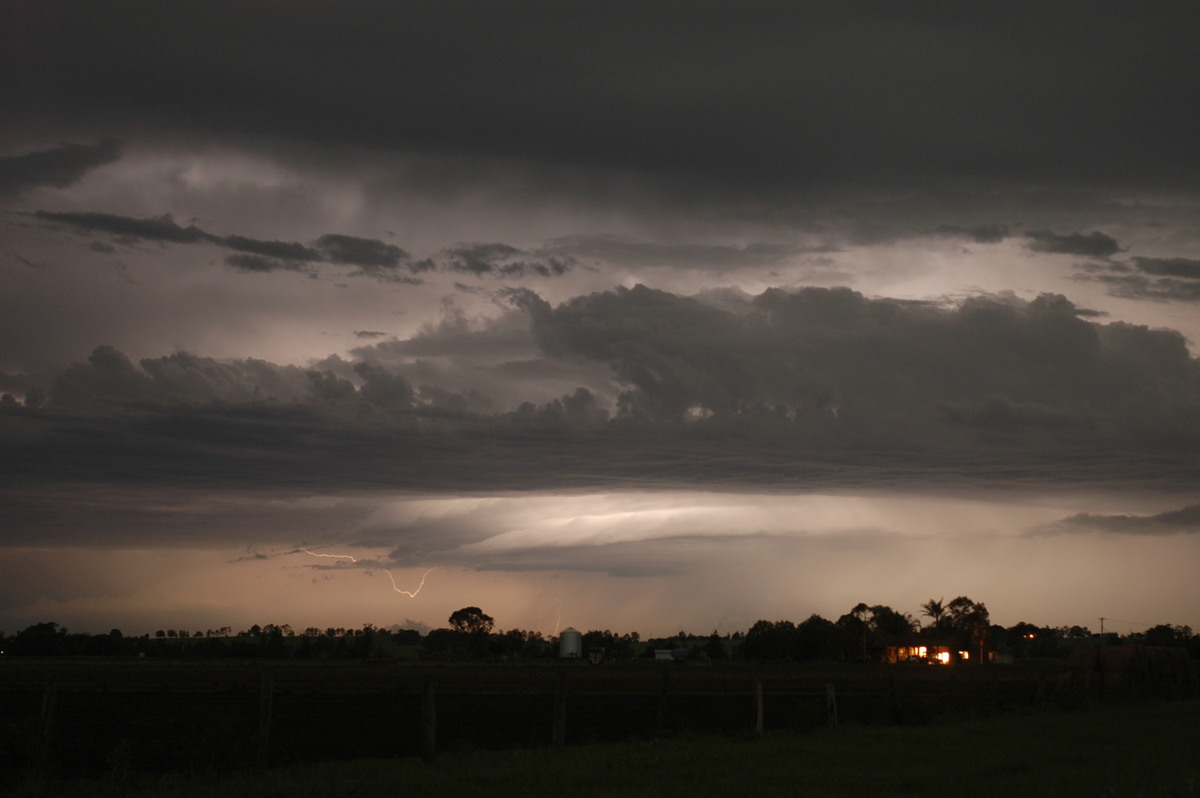
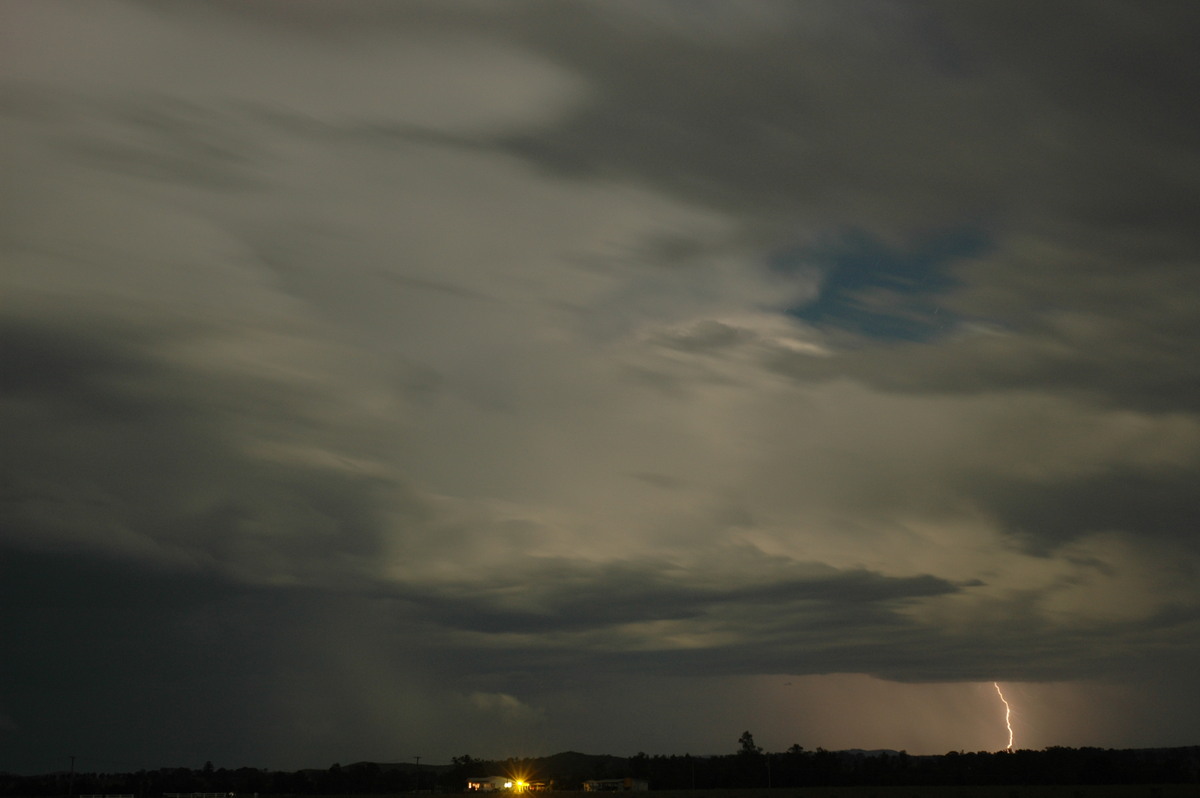
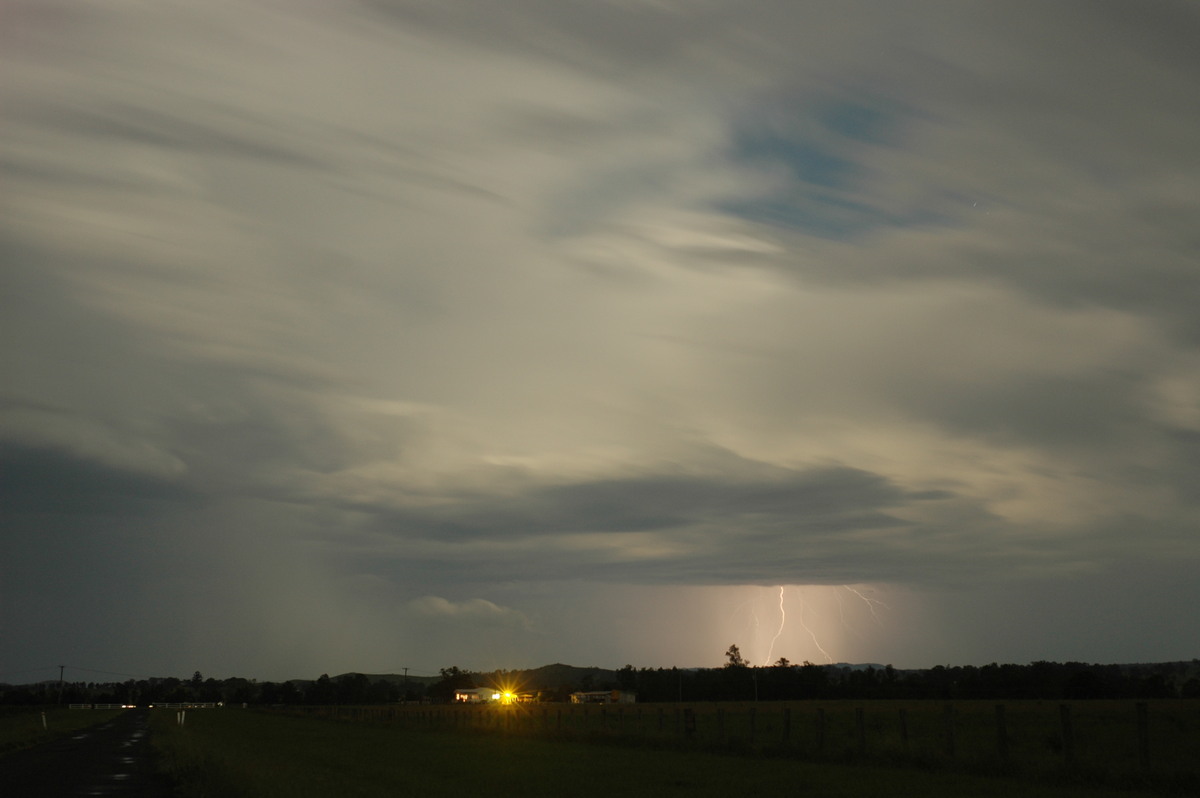
We let this pass and then moved back to NW of Casino for the evening lightning show. Persistent light anvil rain made it difficult at first, but it was still a great show from the storm cluster moving into the Tweed.
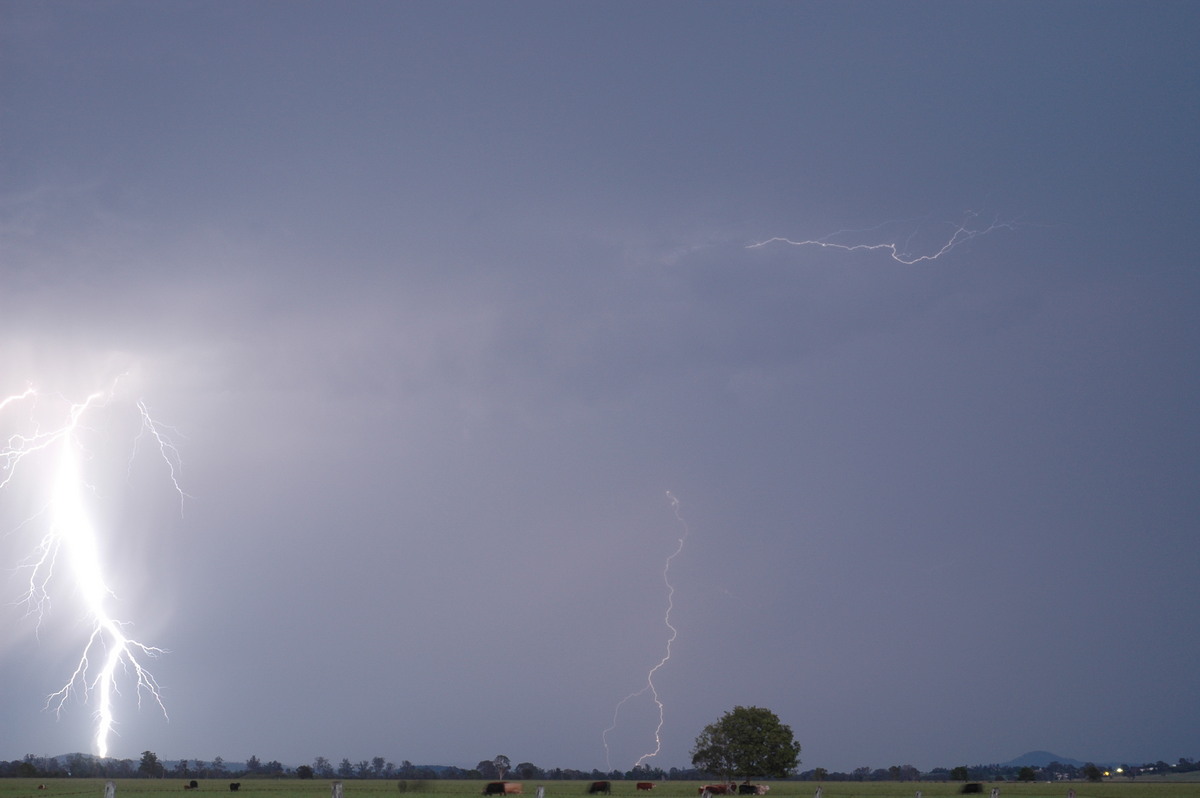
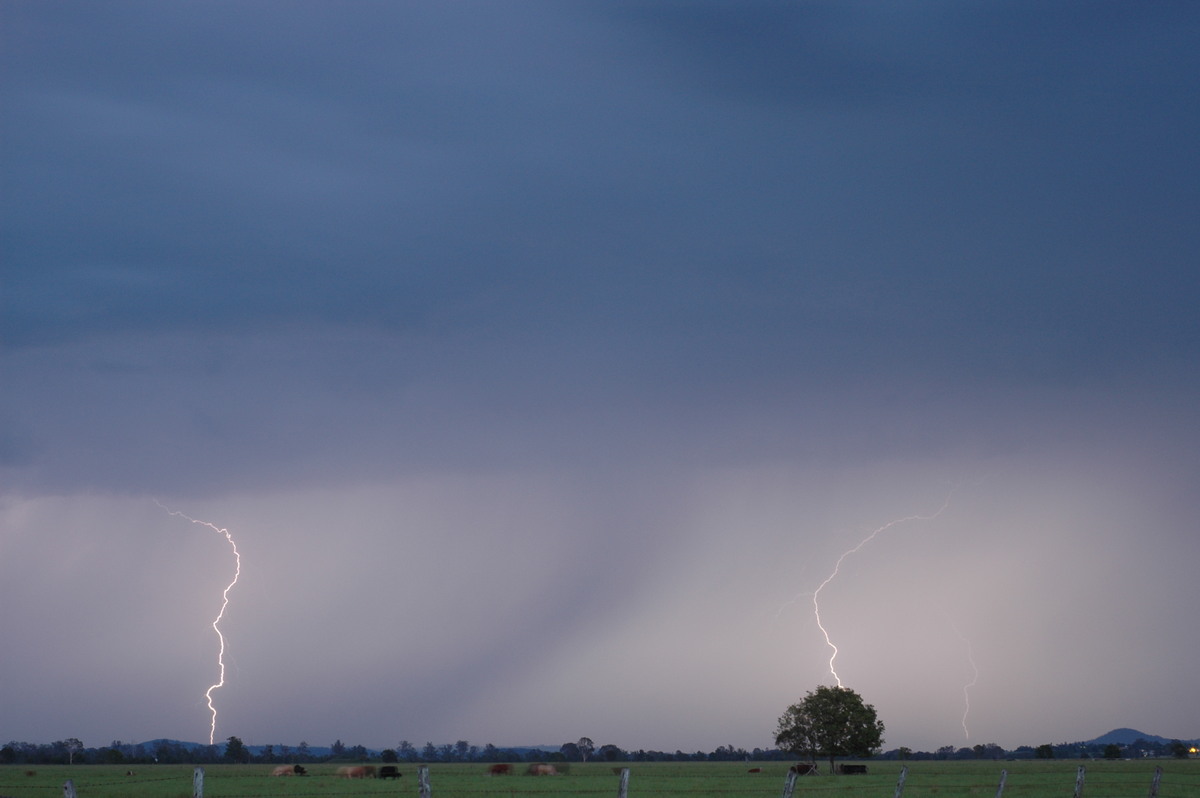
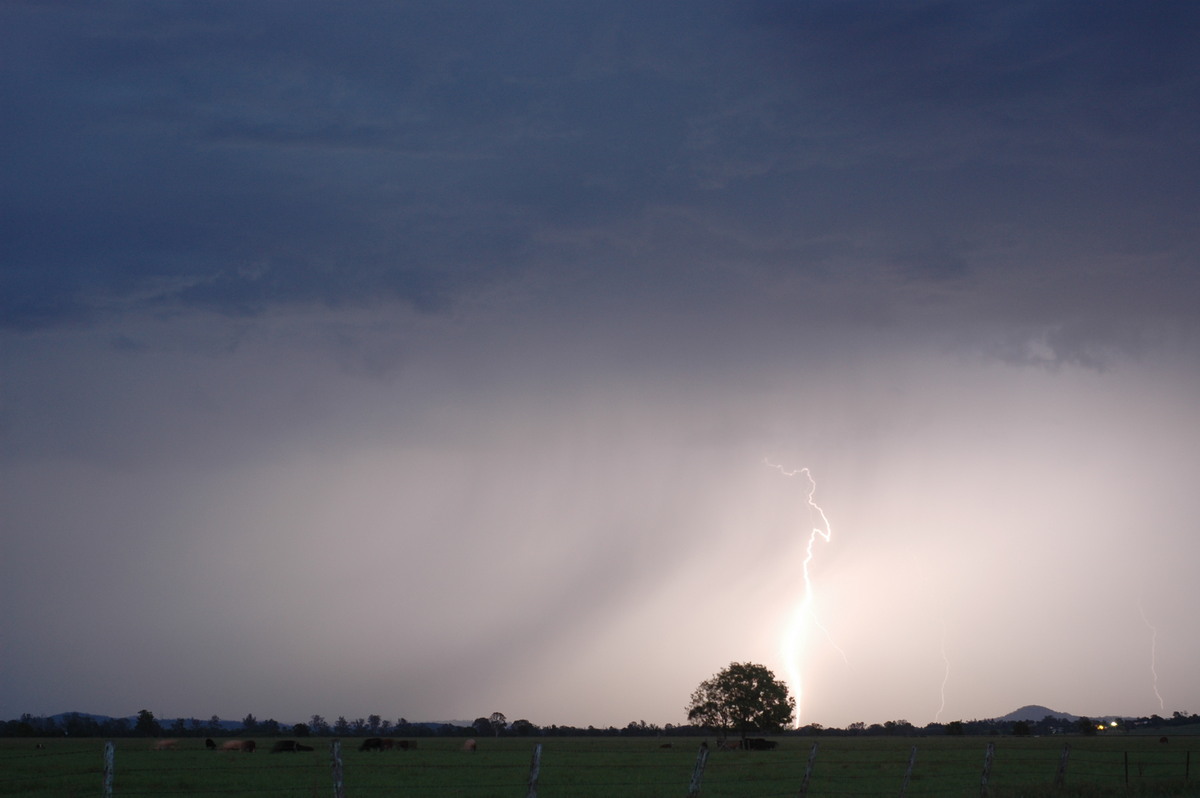
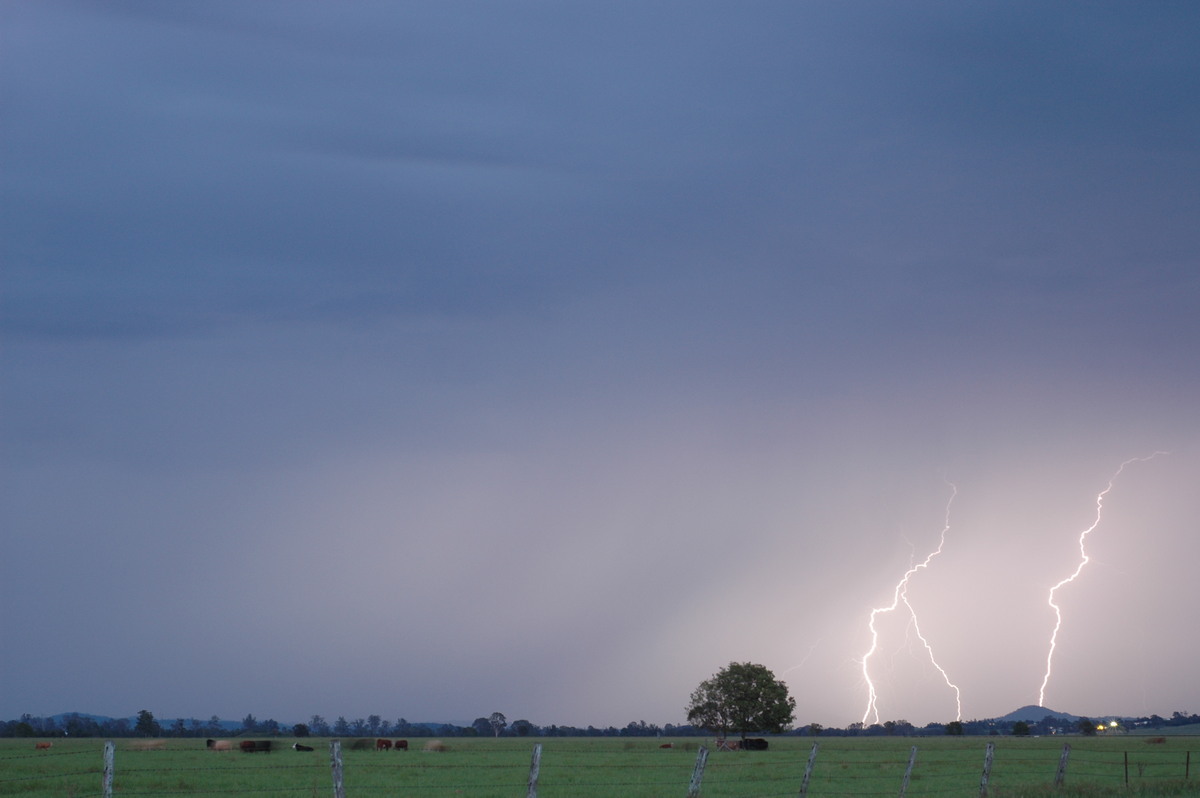
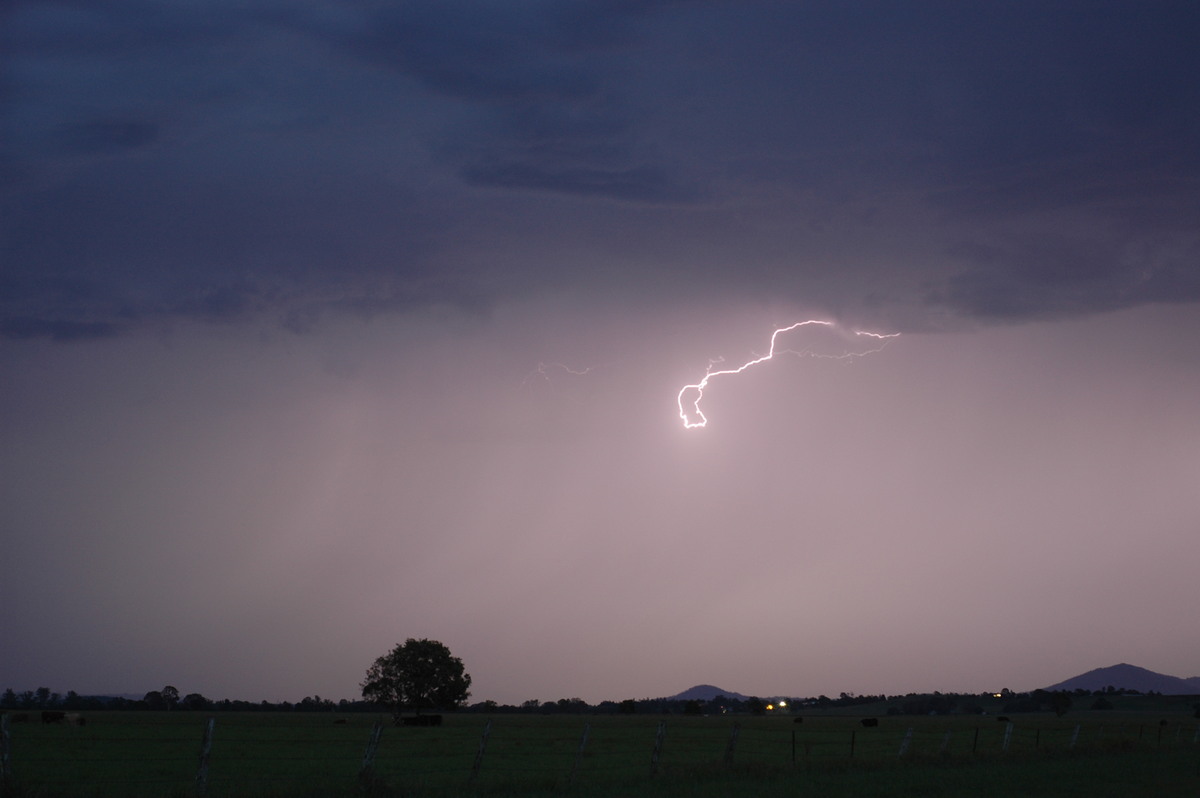
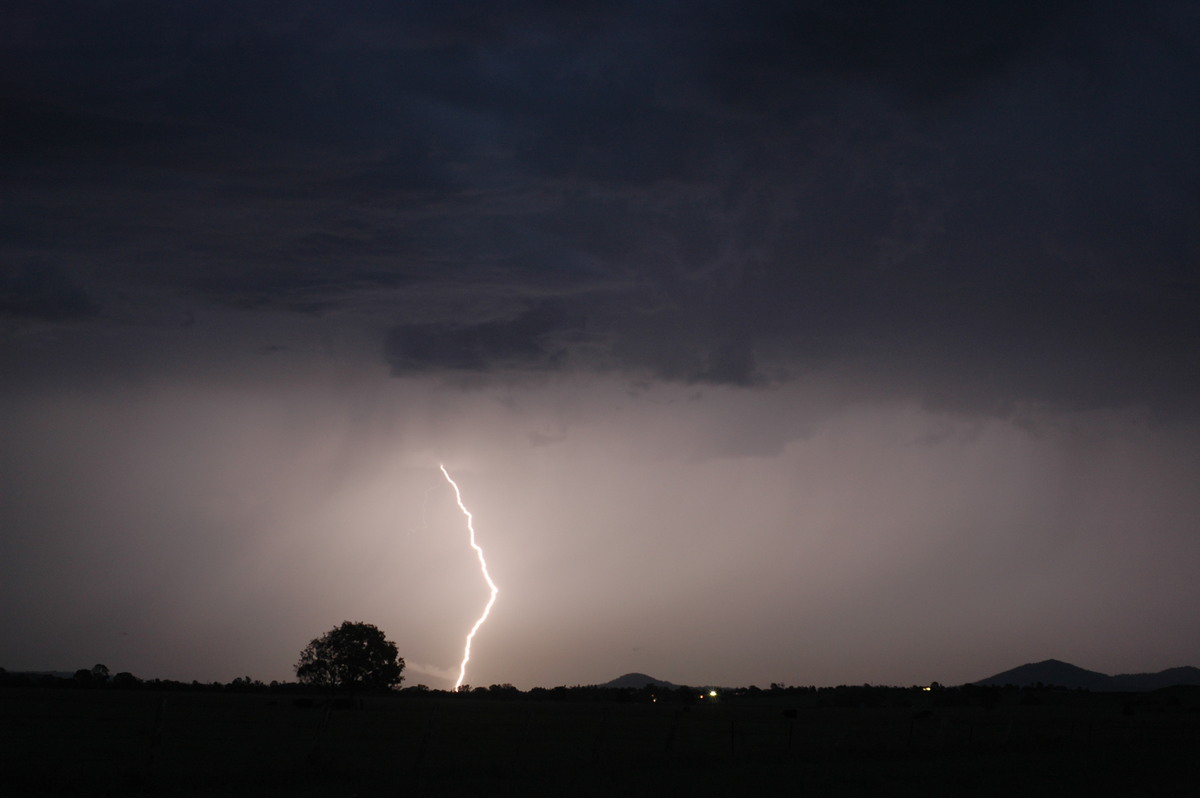
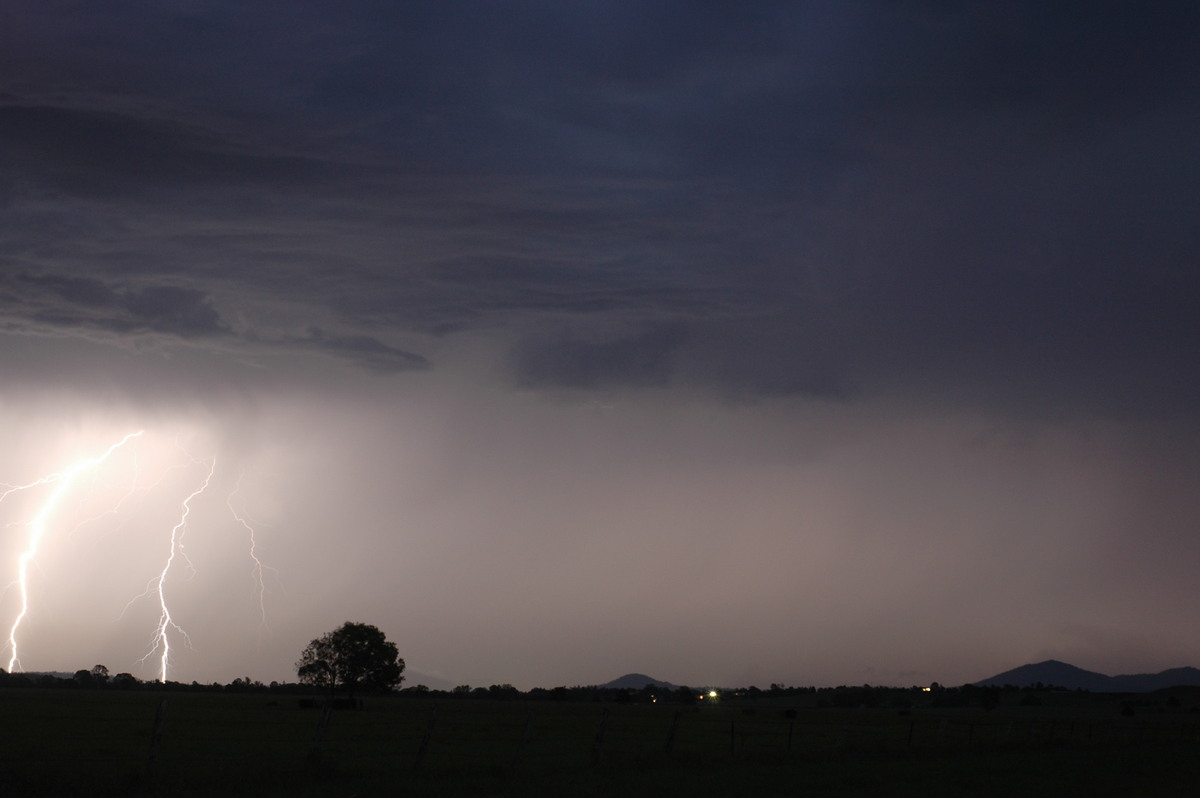
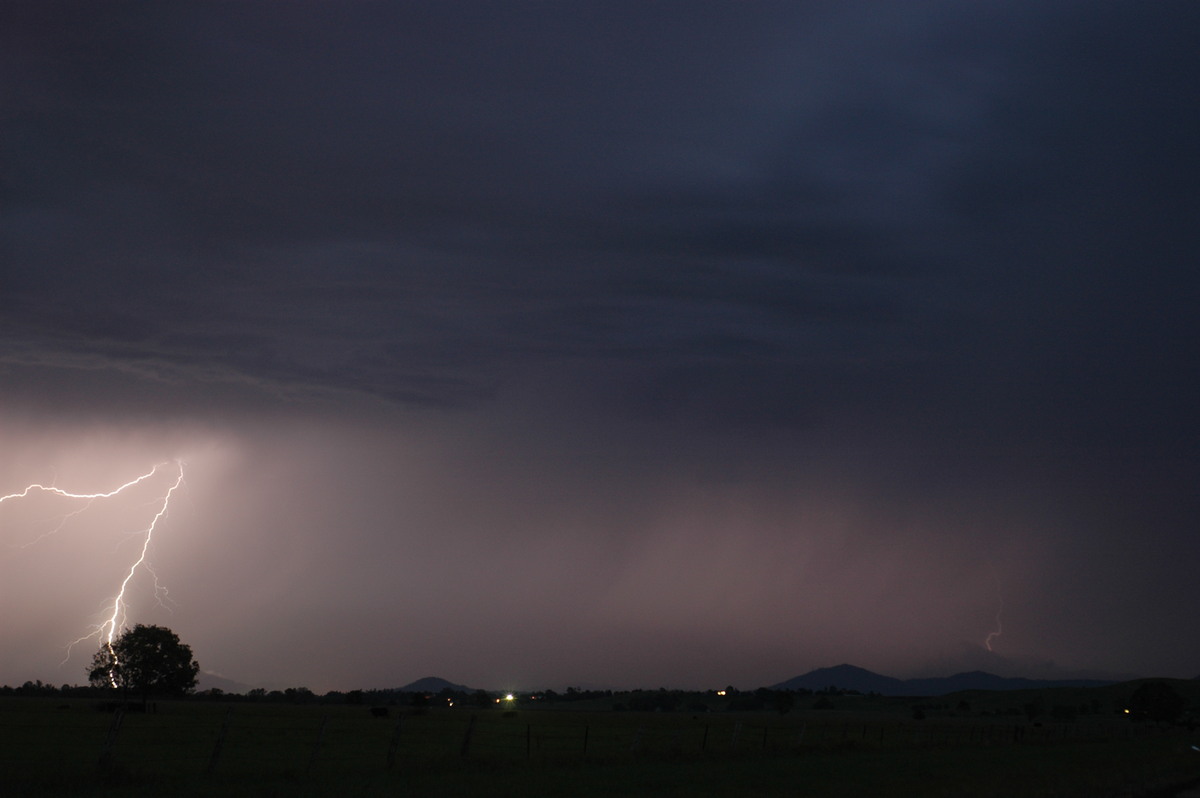
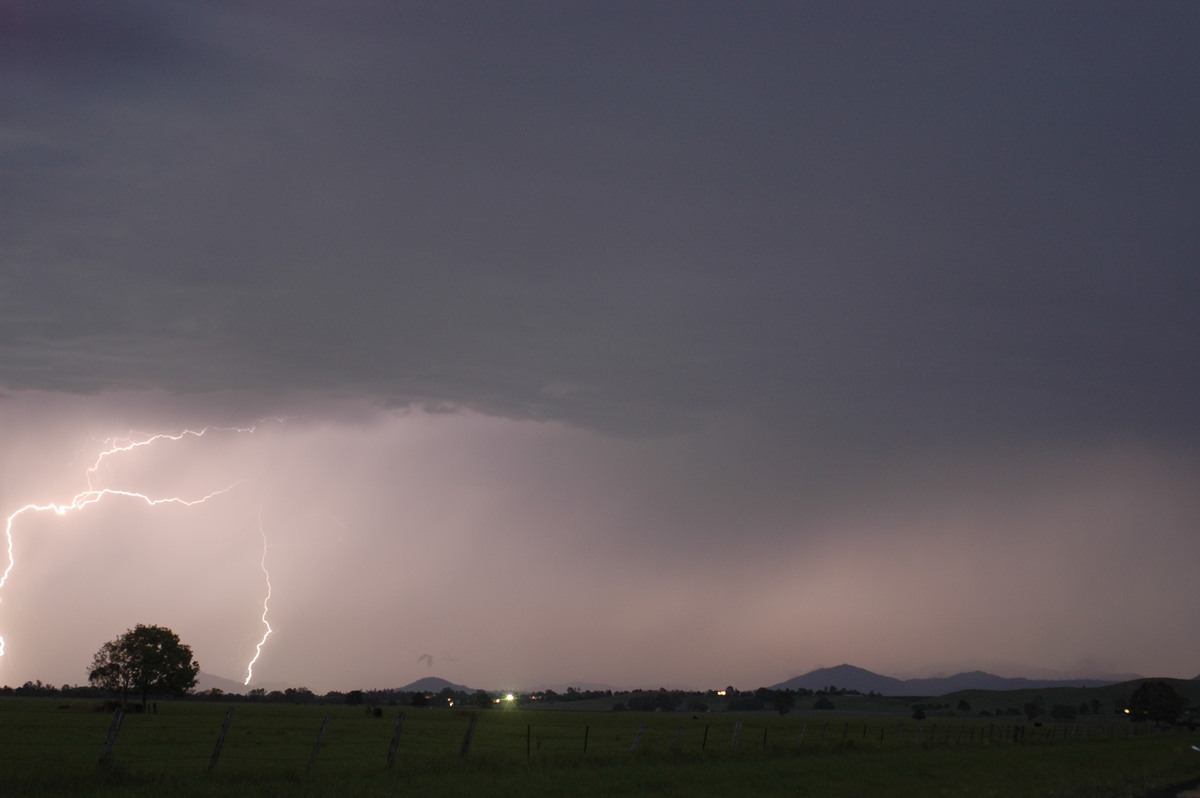
More storms to our far S and SW were very lightning active into the evening but were just not close enough to capture some amazing photos. We called it quits just before 10pm.
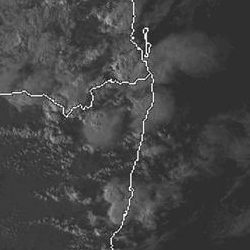
From Weatherzone
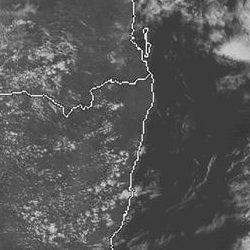
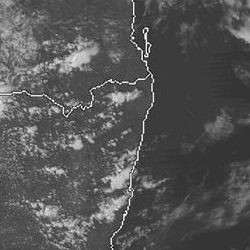
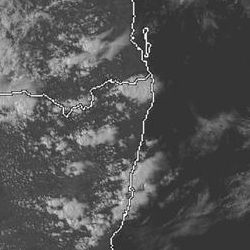
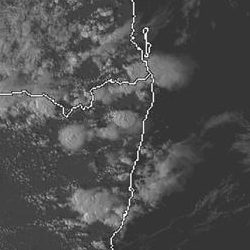
 2pm to 6pm local
From Bureau of Meteorology
 Brisbane sounding at 11am 13/12 local
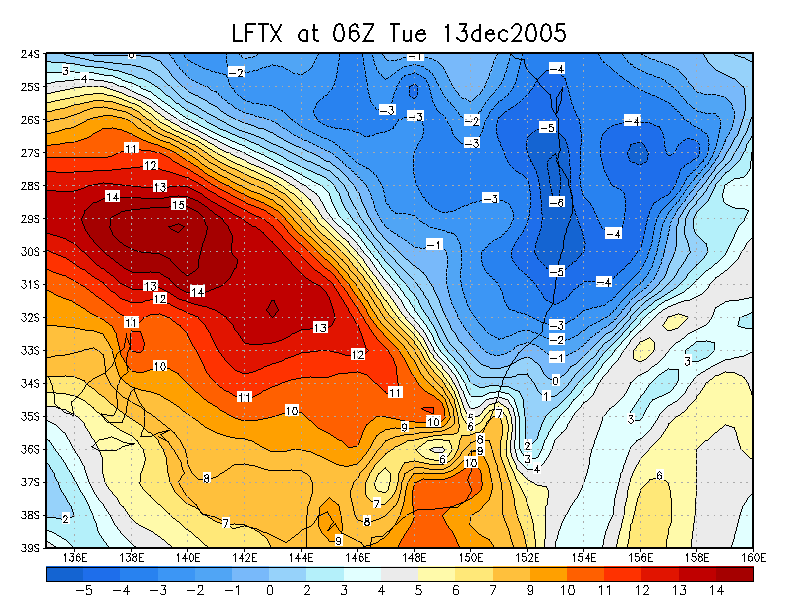
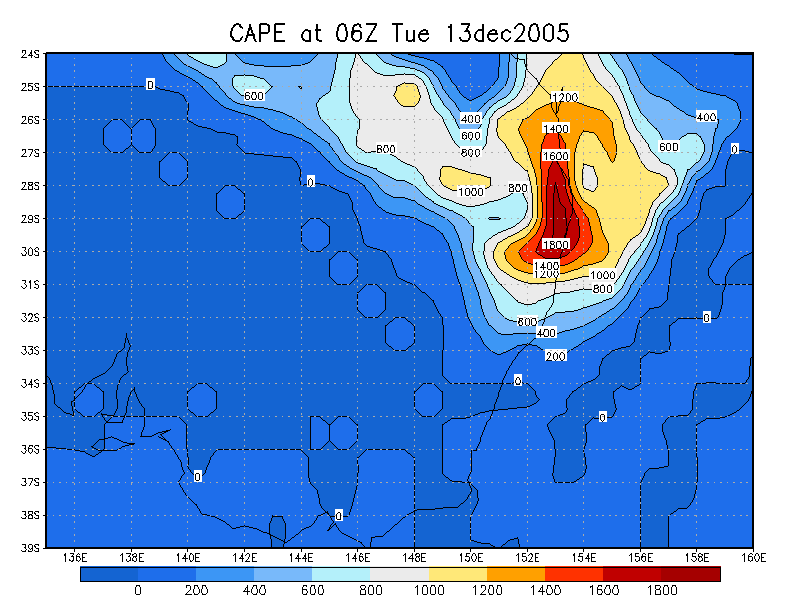
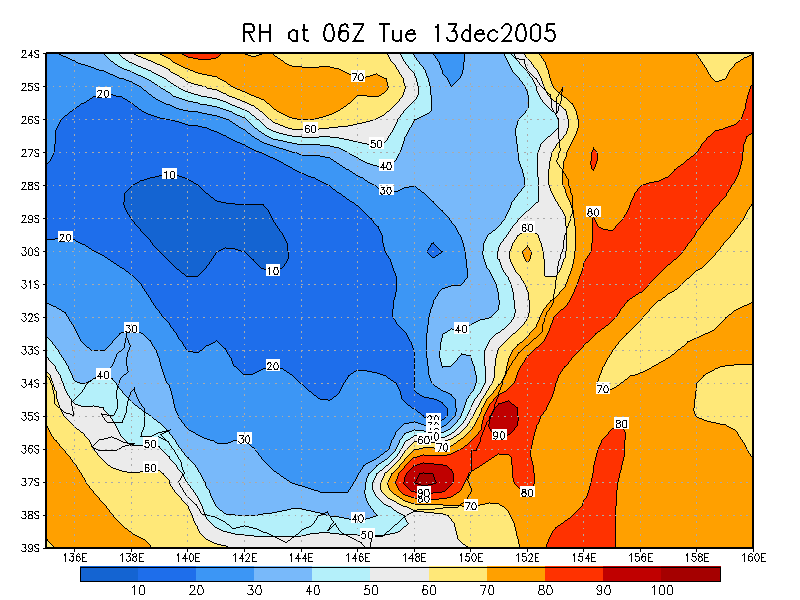
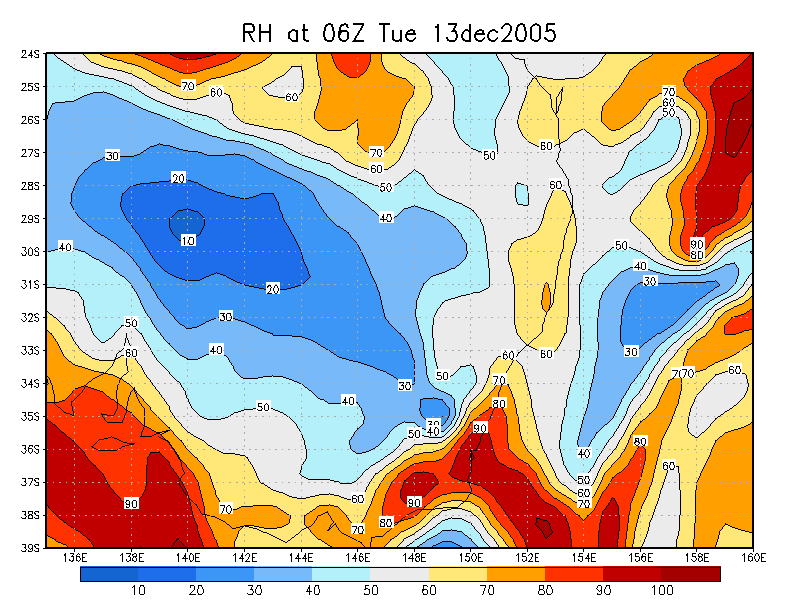
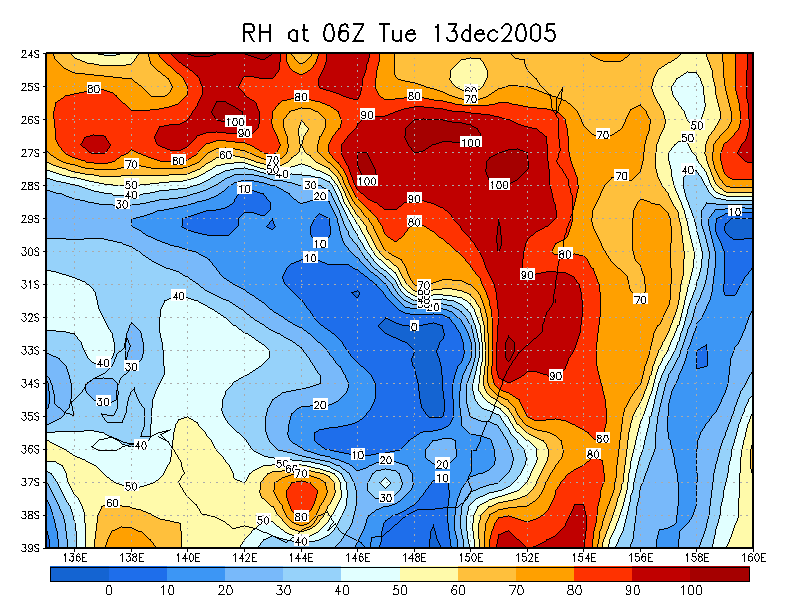
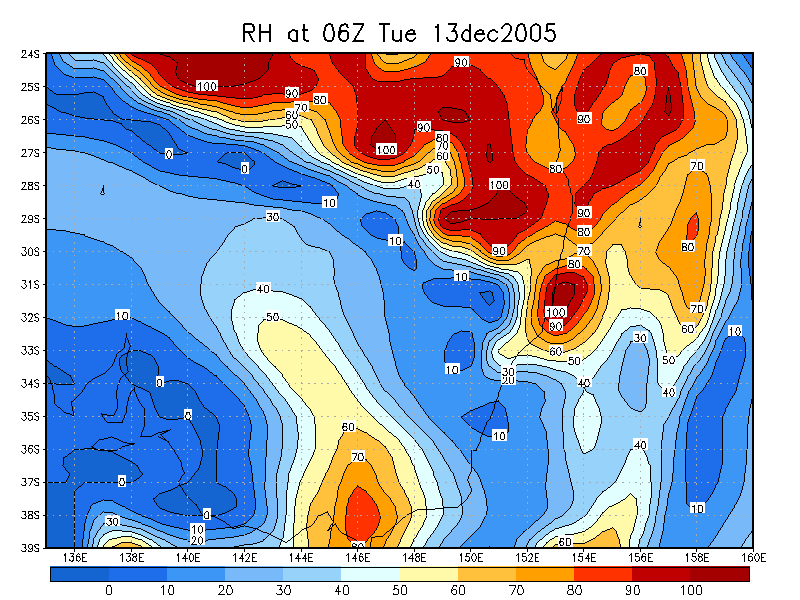
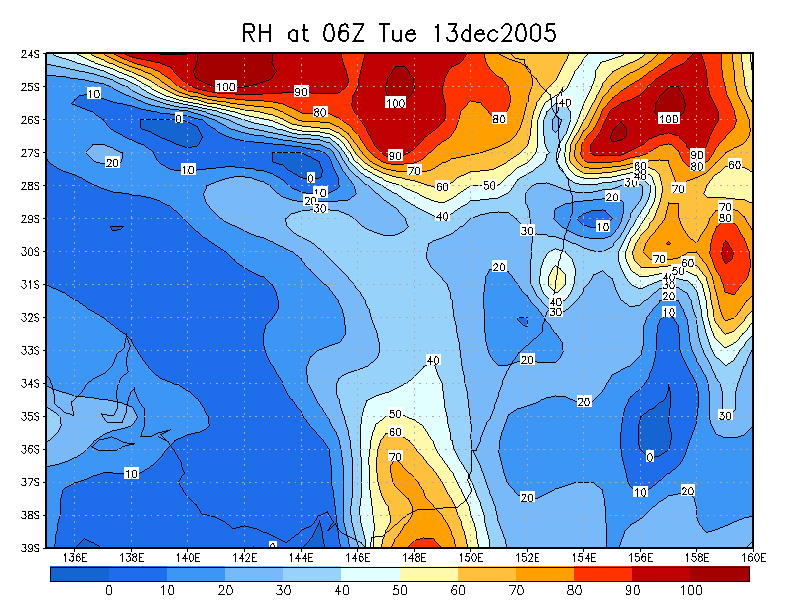
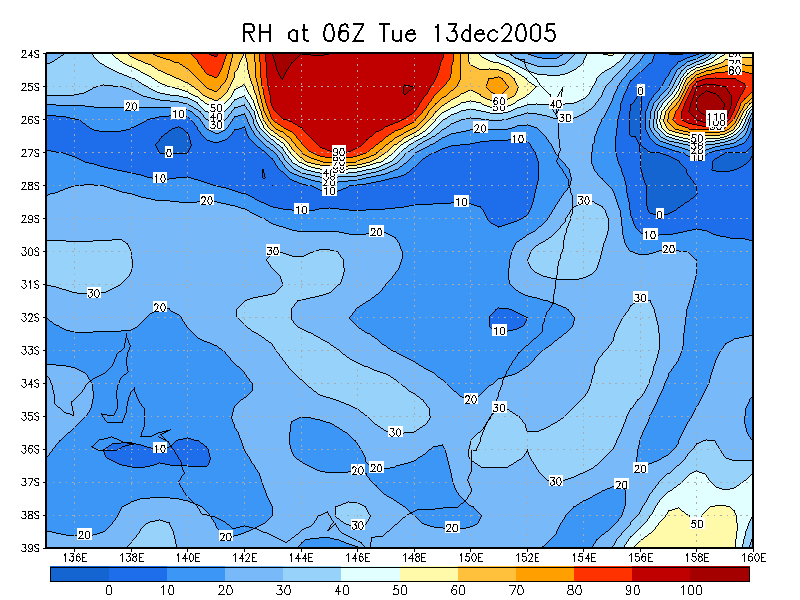
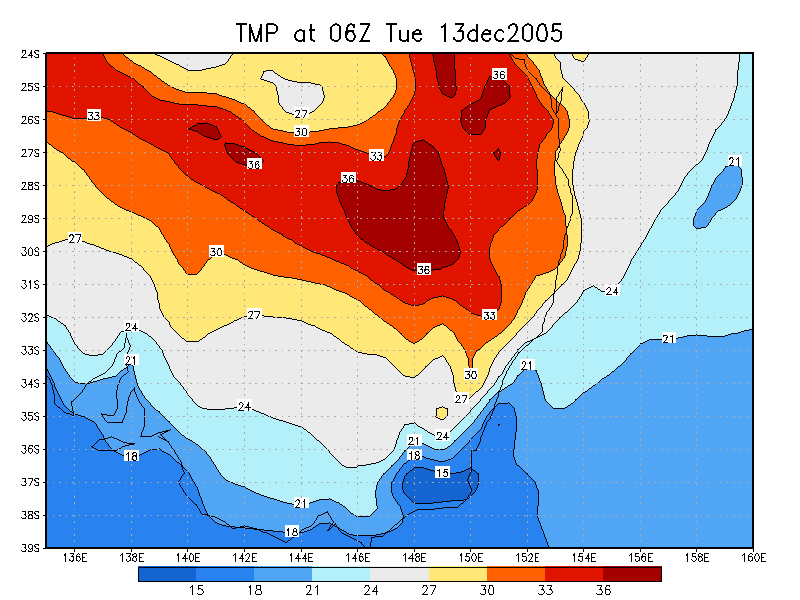
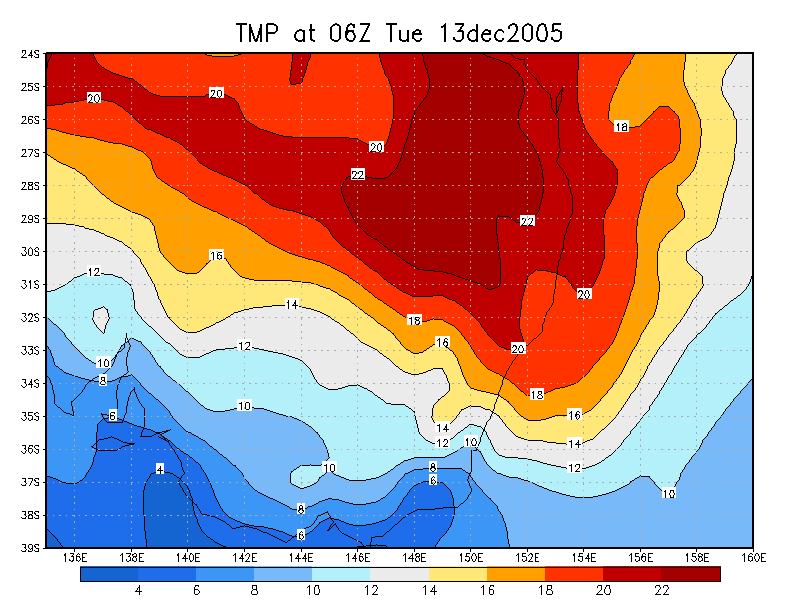
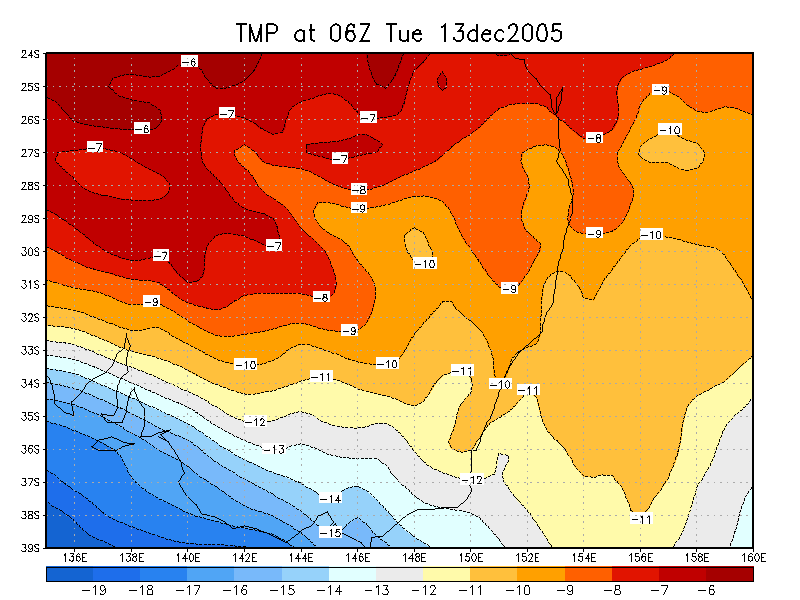
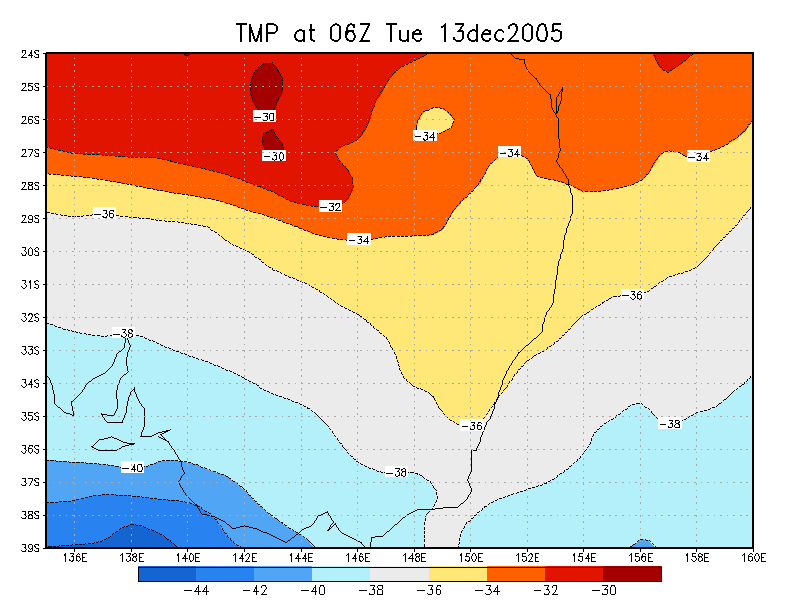
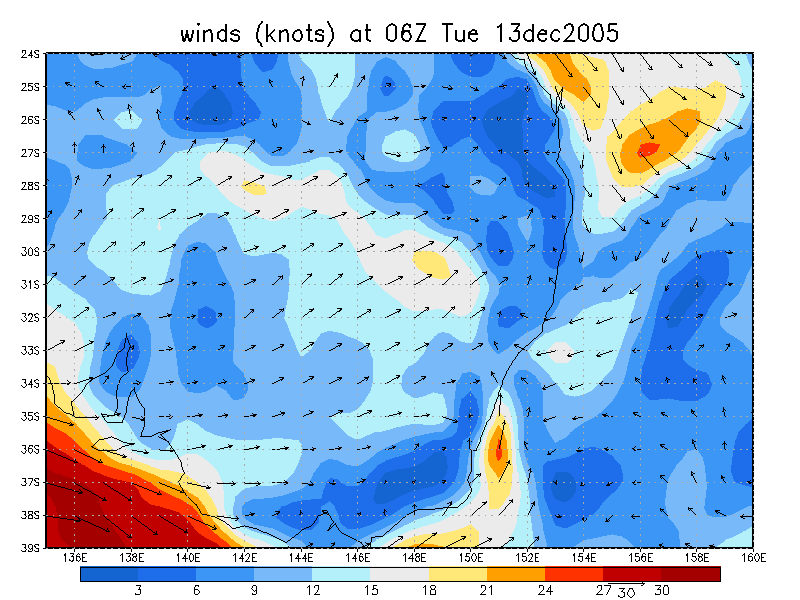
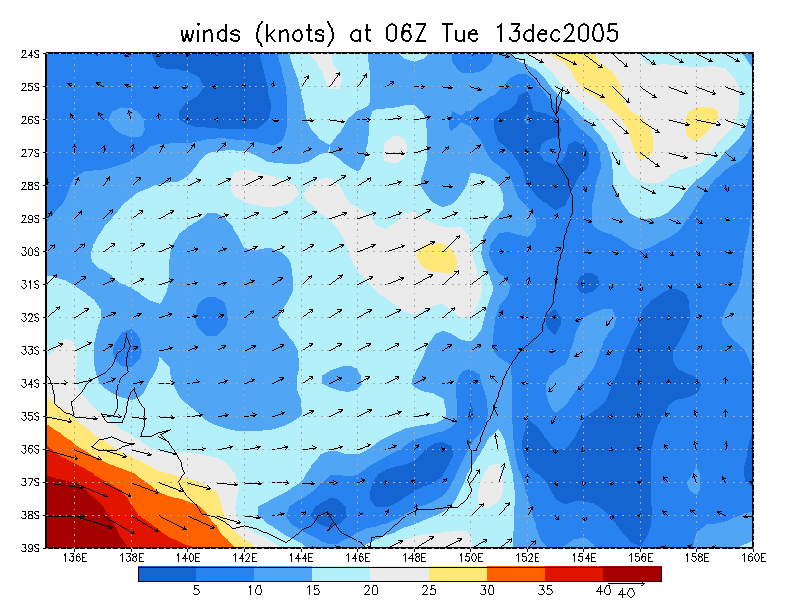
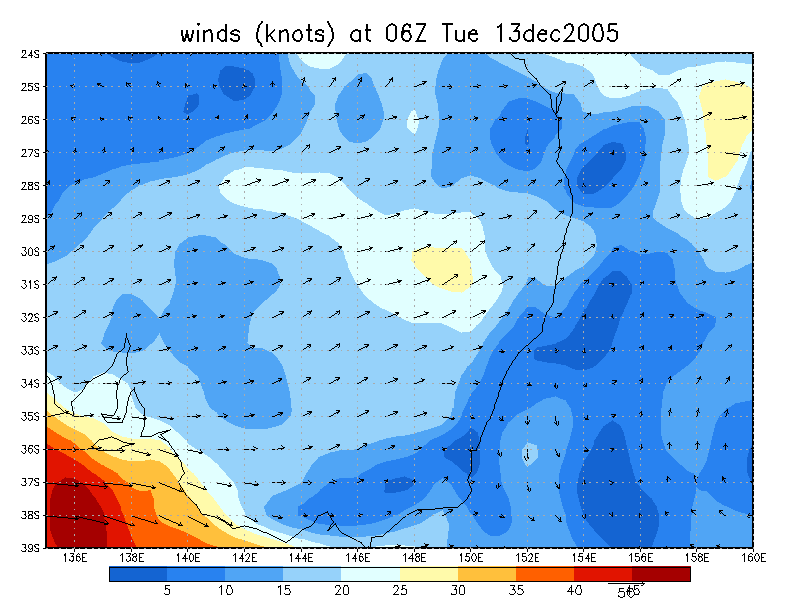
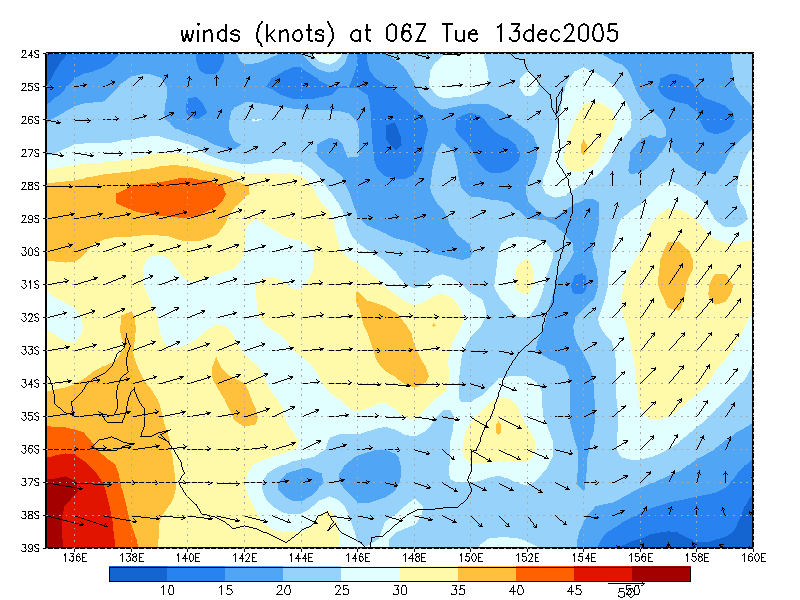
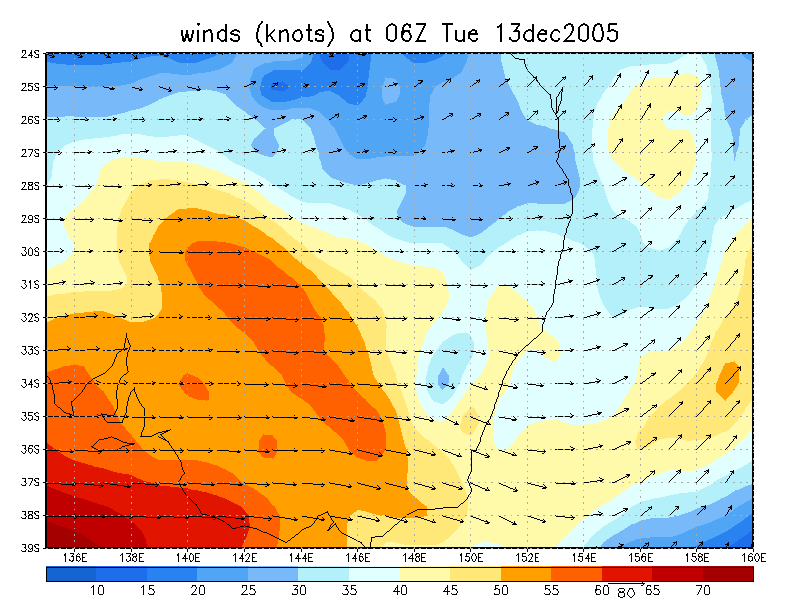
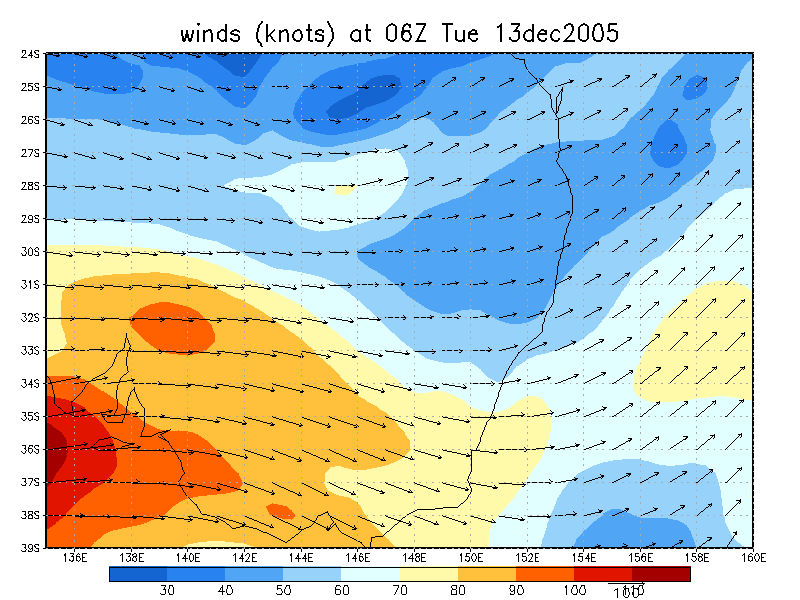
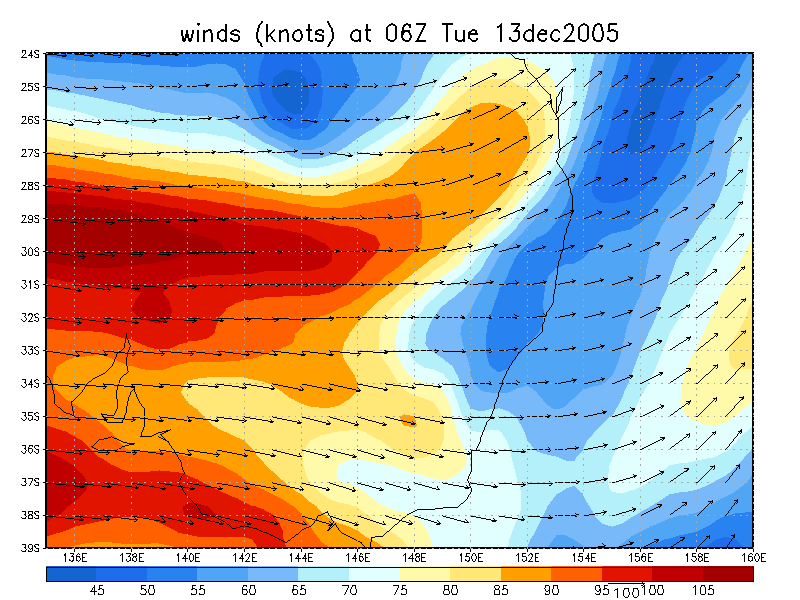
From NOAA 13/12/2005 06z analysis
|
Document: 200512-03.htm Updated: 24th December, 2005 |
[Australian Severe Weather index] [Copyright Notice] [Email Contacts] [Search This Site] |