 Markers:
Show
Hide
Markers:
Show
Hide
Mouse-over the markers to view the TC name, click the marker to load the individual map.
| Tropical Cyclones
[Index] | Australian Region Tropical Cyclone Season 1974-1975 | ||
| Season 1974-1975 Summaries: [BoM-AU] [JTWC-AU] [JTWC-SIO] [JTWC-SPAC] [JTWC-SH] | |||
|
Mouse-over the markers to view the TC name, click the marker to load the individual map.
Markers:
Show
Hide
|
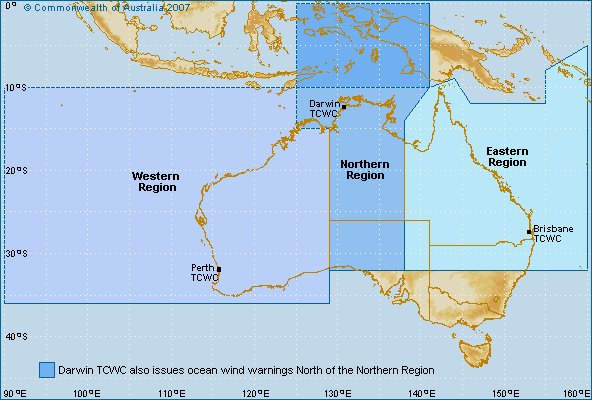
Bureau of Meteorology (BoM) Tropical Cyclone Data
Generally includes all tropical cyclones if the track commenced or moved into the Australian warning areas (between 90 E and 160 E). |
| Cyclone Name | Map ID |
Cyclone Number |
Basin | Date Range (UTC) | Min CP |
Max Winds |
Tracking Map and data |
|---|---|---|---|---|---|---|---|
| MARCIA | 1 | 530 / 197475_01 | SIO | 17 Oct 1974 - 25 Oct 1974 | 988 | 50 | Tropical Cyclone MARCIA |
| NORAH | 2 | 531 / 197475_02 | SIO | 28 Oct 1974 - 04 Nov 1974 | 981 | 60 | Tropical Cyclone NORAH |
| PENNY | 3 | 532 / 197475_03 | SIO | 06 Nov 1974 - 16 Nov 1974 | 981 | 60 | Tropical Cyclone PENNY |
| SELMA | 4 | 533 / 197475_04 | SIO | 29 Nov 1974 - 09 Dec 1974 | 980 | 70 | Tropical Cyclone SELMA |
| TRACY | 5 | 534 / 197475_05 | SIO | 20 Dec 1974 - 26 Dec 1974 | 950 | 95 | Tropical Cyclone TRACY |
| FLORA | 6 | 535 / 197475_06 | SPAC | 12 Jan 1975 - 15 Jan 1975 | 988 | 50 | Tropical Cyclone FLORA |
| ROBYN | 7 | 536 / 197475_07 | SIO | 14 Jan 1975 - 19 Jan 1975 | 964 | 80 | Tropical Cyclone ROBYN |
| GLORIA | 8 | 537 / 197475_08 | SPAC | 15 Jan 1975 - 19 Jan 1975 | 982 | 55 | Tropical Cyclone GLORIA |
| SHIRLEY | 9 | 538 / 197475_09 | SIO | 03 Feb 1975 - 12 Feb 1975 | 981 | 55 | Tropical Cyclone SHIRLEY |
| TRIXIE | 10 | 539 / 197475_10 | SIO | 15 Feb 1975 - 22 Feb 1975 | 925 | 115 | Tropical Cyclone TRIXIE |
| WILMA | 11 | 540 / 197475_12 | SIO | 10 Mar 1975 - 16 Mar 1975 | 980 | 60 | Tropical Cyclone WILMA |
| VIDA | 12 | 541 / 197475_13 | SIO | 16 Mar 1975 - 20 Mar 1975 | 982 | 50 | Tropical Cyclone VIDA |
| BEVERLEY | 13 | 542 / 197475_14 | SIO | 22 Mar 1975 - 03 Apr 1975 | 929 | 110 | Tropical Cyclone BEVERLEY |
| AMELIA | 14 | 543 / 197475_15 | both | 06 Apr 1975 - 09 Apr 1975 | 990 | 40 | Tropical Cyclone AMELIA |
| CLARA | 15 | 544 / 197475_16 | SIO | 20 Apr 1975 - 26 Apr 1975 | 985 | 50 | Tropical Cyclone CLARA |
| DENISE | 16 | 545 / 197475_17 | SIO | 18 May 1975 - 25 May 1975 | 992 | 45 | Tropical Cyclone DENISE |
Minimum central pressure (CP) in hPa. Maximum winds are 10-min average in knots.
Tropical cyclone tracks developed by Michael Bath using data from the Bureau of Meteorology and Google Maps.
|
Document: bom_1974_1975_australian_region_tropical_cyclones.htm
Updated: 6 February 2026 [Australian Severe Weather index] [Copyright Notice] [Email Contacts] [Search This Site] [Privacy Policy] |