 Markers:
Show
Hide
Markers:
Show
Hide
Mouse-over the markers to view the TC name, click the marker to load the individual map.
| Tropical Cyclones
[Index] | Australian Region Tropical Cyclone Season 2019-2020 | ||
| Season 2019-2020 Summaries: [BoM-AU] [JTWC-AU] [JTWC-SIO] [JTWC-SPAC] [JTWC-SH] | |||
|
Mouse-over the markers to view the TC name, click the marker to load the individual map.
Markers:
Show
Hide
|
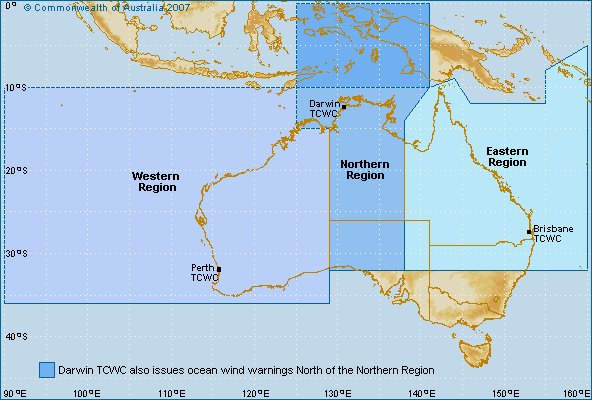
Bureau of Meteorology (BoM) Tropical Cyclone Data
Generally includes all tropical cyclones if the track commenced or moved into the Australian warning areas (between 90 E and 160 E). |
| Cyclone Name | Map ID |
Cyclone Number |
Basin | Date Range (UTC) | Min CP |
Max Winds |
Tracking Map and data |
|---|---|---|---|---|---|---|---|
| BLAKE | 1 | 1025 / 201920_02 | SIO | 04 Jan 2020 - 08 Jan 2020 | 986 | 40 | Tropical Cyclone BLAKE |
| CLAUDIA | 2 | 1026 / 201920_03 | both | 05 Jan 2020 - 19 Jan 2020 | 963 | 80 | Tropical Cyclone CLAUDIA |
| DAMIEN | 3 | 1027 / 201920_05 | SIO | 03 Feb 2020 - 10 Feb 2020 | 955 | 85 | Tropical Cyclone DAMIEN |
| UESI | 4 | 1028 / 201920_06 | SPAC | 06 Feb 2020 - 17 Feb 2020 | 975 | 70 | Tropical Cyclone UESI |
| ESTHER | 5 | 1029 / 201920_07 | both | 21 Feb 2020 - 04 Mar 2020 | 988 | 40 | Tropical Cyclone ESTHER |
| FERDINAND | 6 | 1030 / 201920_08 | SIO | 22 Feb 2020 - 01 Mar 2020 | 960 | 85 | Tropical Cyclone FERDINAND |
| GRETEL | 7 | 1031 / 201920_10 | SPAC | 10 Mar 2020 - 16 Mar 2020 | 982 | 50 | Tropical Cyclone GRETEL |
| 201920_11 | 8 | 1032 / 201920_11 | SPAC | 31 Mar 2020 - 03 Apr 2020 | 999 | 30 | Tropical Cyclone 201920_11 |
| HAROLD | 9 | 1033 / 201920_12 | SPAC | 01 Apr 2020 - 11 Apr 2020 | 920 | 125 | Tropical Cyclone HAROLD |
Minimum central pressure (CP) in hPa. Maximum winds are 10-min average in knots.
Tropical cyclone tracks developed by Michael Bath using data from the Bureau of Meteorology and Google Maps.
|
Document: bom_2019_2020_australian_region_tropical_cyclones.htm
Updated: 6 February 2026 [Australian Severe Weather index] [Copyright Notice] [Email Contacts] [Search This Site] [Privacy Policy] |